
1.1.2 What is nutritional risk and how is it measured?
In adults and older people
Due to lack of adequate nutrition, acute or chronic disease and/or treatment, an individual may move from a good nutritional status to frank malnutrition in a matter of weeks, months or years. Severe malnutrition/emaciation may be clinically obvious, but as uncertainty exists in detecting lesser degrees of malnutrition (due to the lack of universally agreed criteria), the concept of ‘risk’ is useful.18 Malnutrition risk is defined as ‘a measure of the likelihood that malnutrition is present or likely to develop’ 18 and is in itself a condition related to increased morbidity and mortality.2 Therefore establishing malnutrition risk aims to identify those individuals who are at risk of adverse outcomes and who might benefit clinically from nutritional support.19 In addition to the risks mentioned in Figure 1.2, severity of disease, psychological status, and mobility may also affect the risk of malnutrition. 20,21
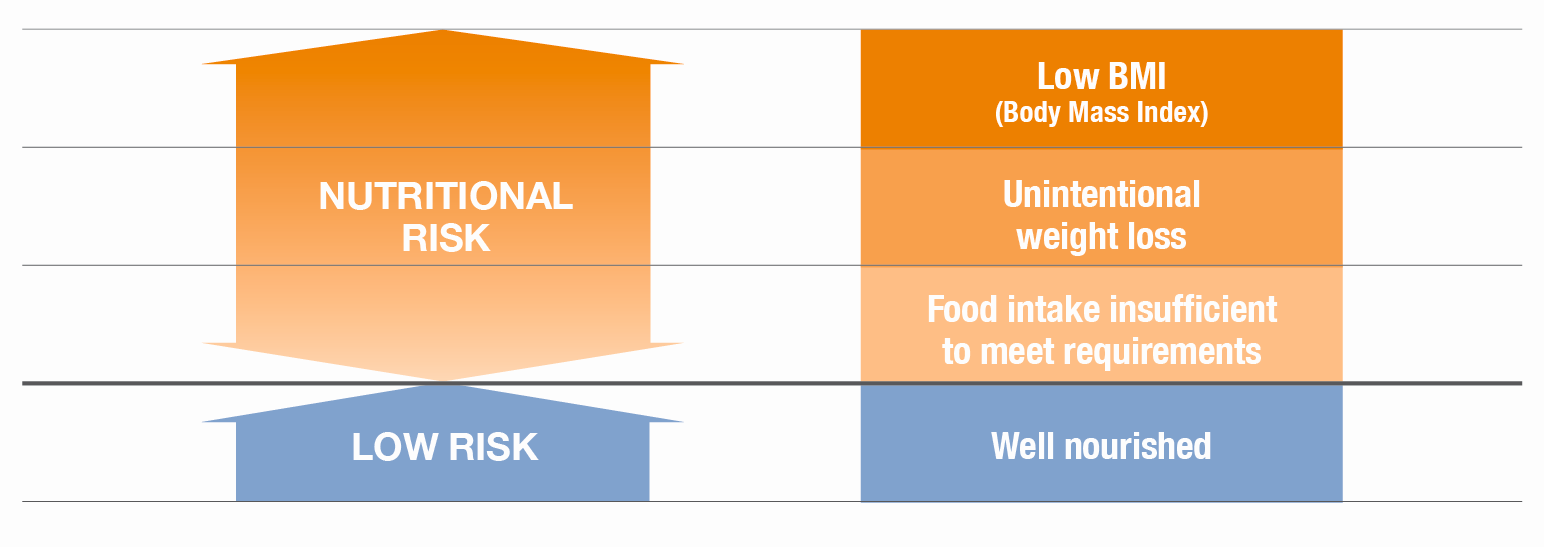
The concept of nutritional risk
Reflecting common practice, in this report the term ‘malnutrition’ is used synonymously with under-nutrition and nutritional risk.
Nutritional risk is of relevance because:
- it is widespread, particularly in patients admitted to hospital, residents in care homes, and people receiving community care;
- it has severe clinical consequences: weight loss, functional impairments, impaired quality of life, increased complications, and higher mortality;
- it results in economic consequences from increased consumption of healthcare resources due to management of complications, prolonged length of stay in hospital, increased readmission to hospital, need for community care, and thereby increased costs;
- it is frequently under-recognised and therefore under-treated;
- it is particularly common in the older person. Given that the population is aging (the number of older people in Europe aged 65–79 years will increase by 37.4% by 2030)22 and that the problem is often unrecognised, this means that the costs to healthcare systems are likely to escalate at an unprecedented rate due to adverse clinical consequences.
Malnutrition in older adults poses unique challenges, as it negatively impacts health, cognitive and physical function, and quality of life. The MaNuEL initiative recommended setting-specific screening tools: DETERMINE for community care, NFE for rehabilitation, SNAQ-RC for residential care, and MST or MNA-SF for hospitals. A meta-analysis identified risk factors, including advanced age, being unmarried, mobility issues, and recent hospitalisations. Gender-specific predictors included cognitive impairment and social support for women, and falls, hospitalisations, and mobility difficulties for men. Early identification and management of these risks can mitigate adverse outcomes and reduce healthcare burdens.23
Screening can be defined as ‘an initial brief evaluation, which often precedes an in-depth and more accurate evaluation, of those considered to be at risk of a particular disease or condition’.18
Summary of the main differences between nutritional screening and nutritional assessment (adapted from Elia 2003)9
| Nutritional screening | Nutritional assessment |
|---|---|
|
|
|
|
|
|
|
|
|
The act of regular nutritional screening applies a test to a whole population (e.g. on admission to hospital or a nursing home) to identify individuals who are ‘at risk’ of malnutrition to ensure that timely and appropriate nutritional care is provided. Figure 1.3 illustrates that nutritional screening is intended to identify individuals who are ‘at risk’ of malnutrition across the spectrum of nutritional status. An ‘at risk’ status may result from the effects of disease or treatment, or it may arise in a well-nourished individual due to an acute event such as sustaining an injury or undergoing emergency surgery that will result in no nutritional intake for a period of time. Additionally, the severity of the disease, the individual’s psychological status, and their mobility can greatly affect their risk of malnutrition.20, 21 Individuals identified as high-risk are likely to be, but are not necessarily, frankly malnourished, although a more detailed nutritional assessment should be undertaken for ‘at risk’ individuals to establish the degree of malnutrition present, its causes, and the best course of action.
Given time and resource constraints in hospital settings, full nutritional assessments are not feasible for every patient. Nutritional screening offers a faster, cost-effective solution, allowing timely identification and intervention for at-risk individuals. 24
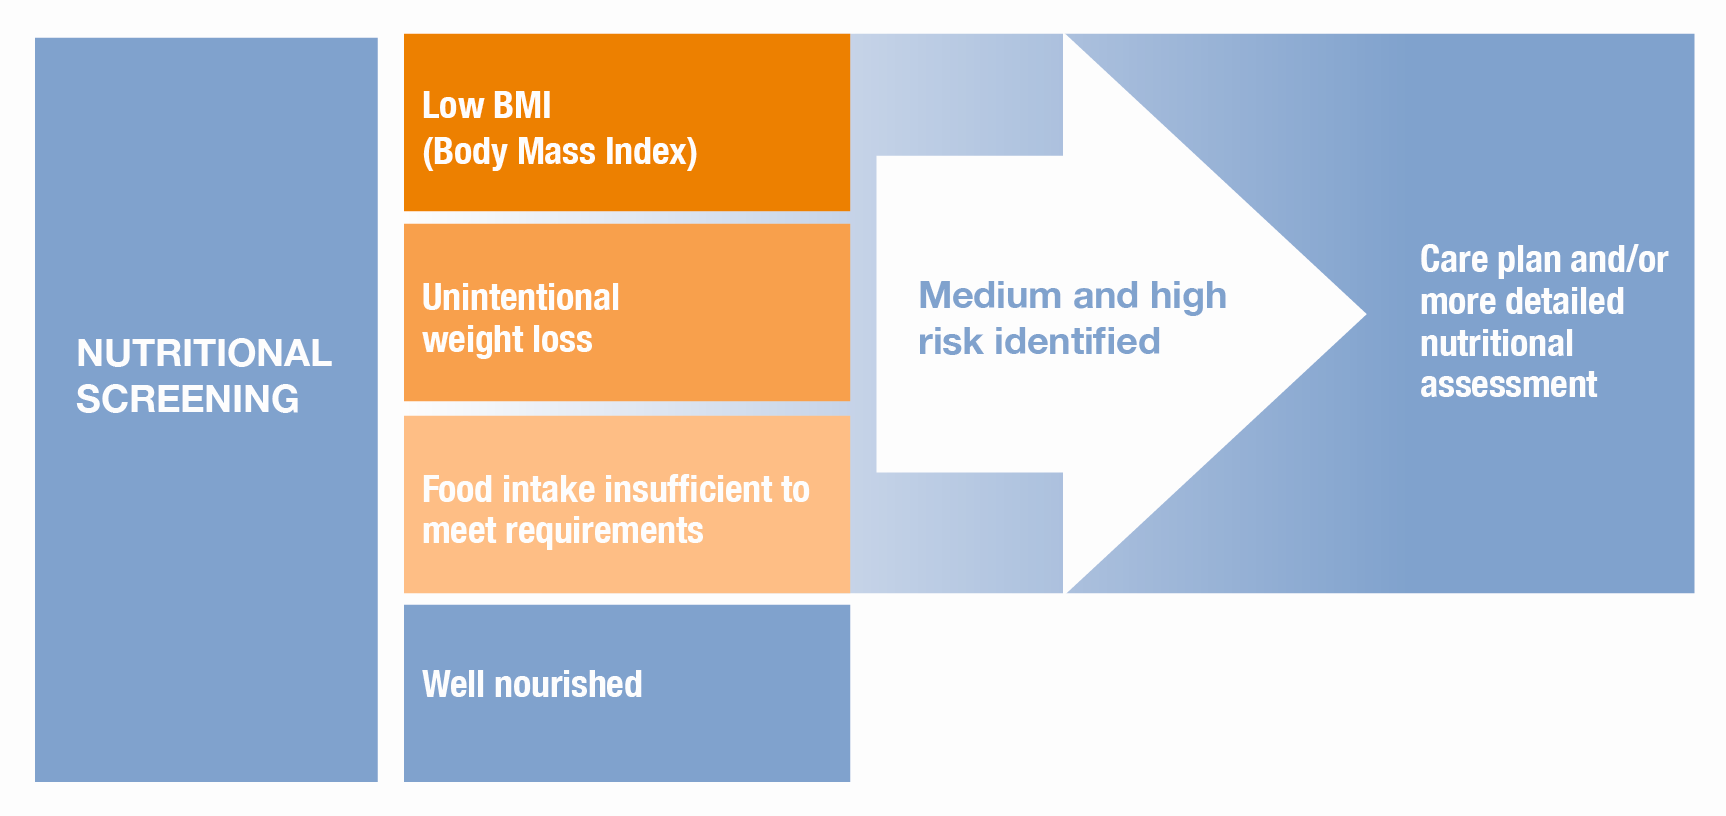
Individuals identified as ‘at-risk’ of malnutrition through nutritional screening may have different degrees of malnutrition
Different screening tests or tools use different criteria and/or cut-off points and/or weightings to detect nutritional risk. Furthermore, some tools have been developed for specific purposes or settings, or for use by specific healthcare workers.18,25 This means that not all individuals identified as ‘at risk’ are at the same point on the malnutrition spectrum (this is true even if a single tool is used). Figure 1.4 shows examples of screening tools in different settings and Table 1.3 shows some examples of commonly used screening tools designed for use in adults or older people and summarises their main components.
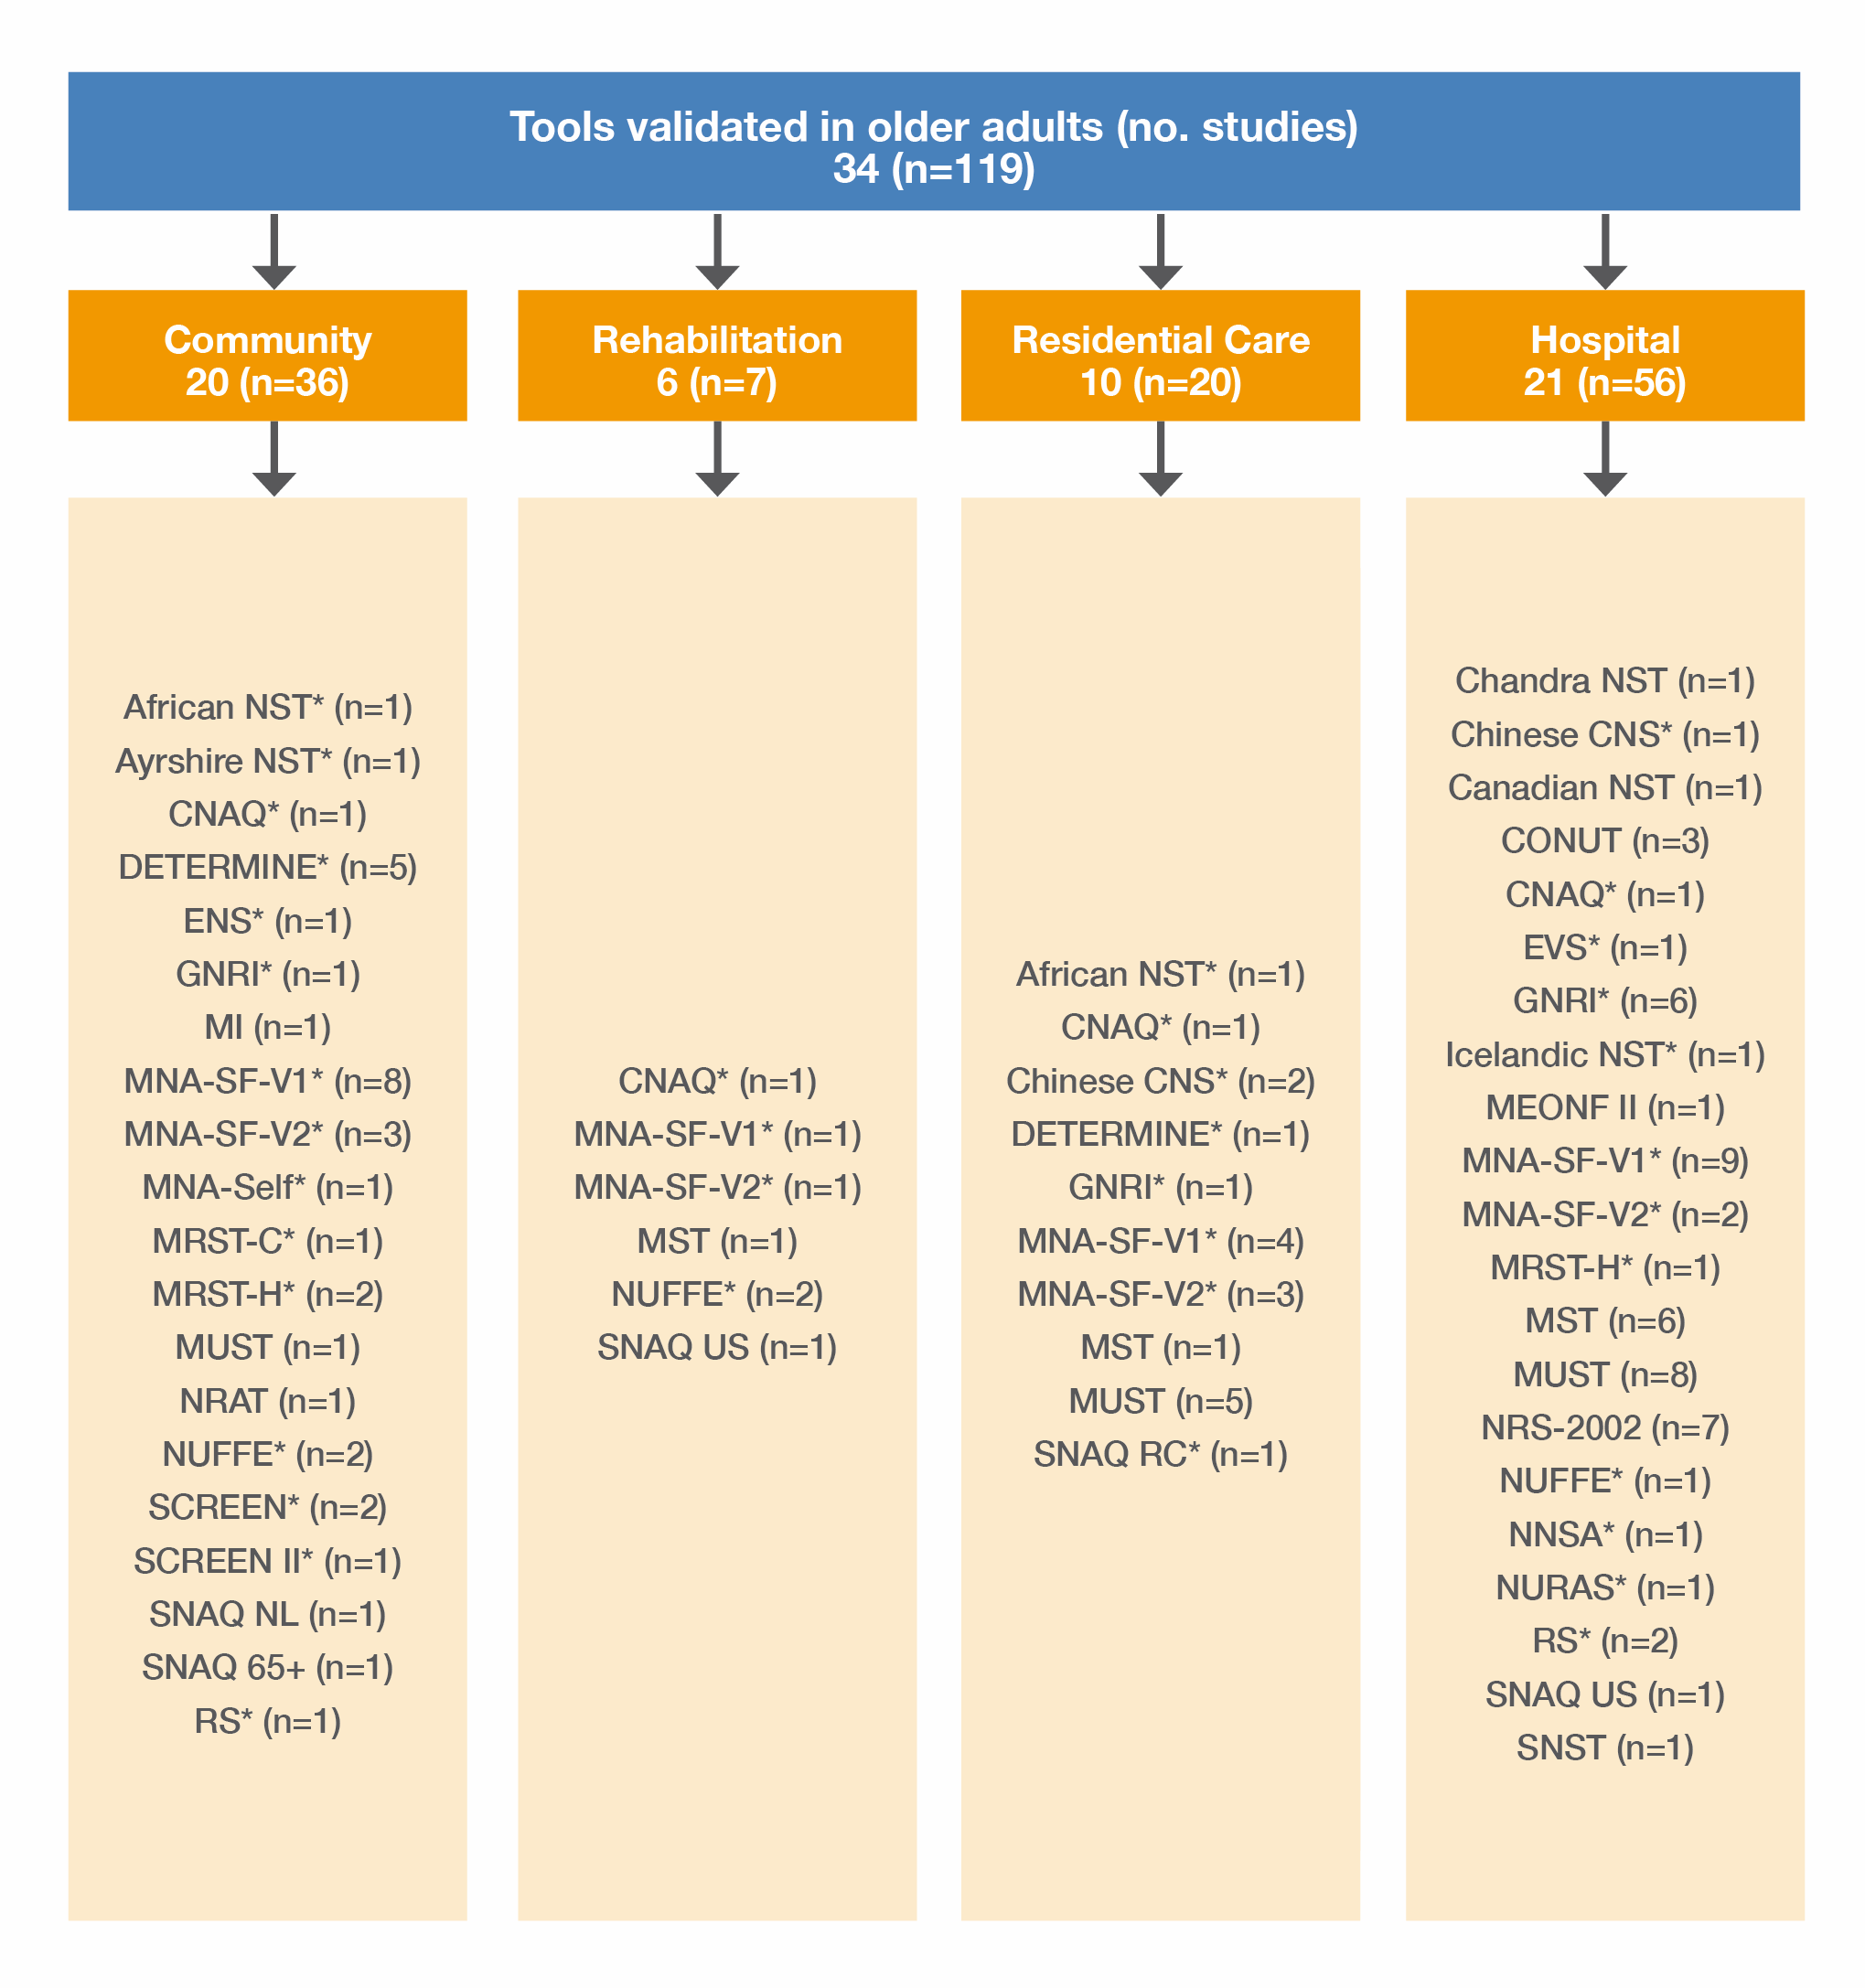
Malnutrition screening tools validated in older adults by healthcare setting (adapted from Power et al 2018)26
Summary of components included in nutritional risk screening tools specifically designed for use in adults or older people
| Reference | Tool | Age group & healthcare setting | Anthropometric measures | Weight loss | Nutritional intake | Other | Linked to action plan |
|---|---|---|---|---|---|---|---|
| Elia 200318 | MUST* | Adults Multiple care settings |
✓ (BMI**) | ✓ | ✓ | Acute disease effect | Yes |
| Kondrup et al. 200327 | NRS-2002 | Adults + option for ≥ 70 yrs Hospital |
✓ (BMI) | ✓ | ✓ | Severity of illness, age | Prompts user to initiate a care plan |
| Rubenstein et al. 200128 | MNA-SF† | Older people Multiple care settings |
✓ (BMI or calf circumference) | ✓ | ✓ | Mobility, acute disease/physical stress, neuropsychological problems | Yes |
| Kruizenga et al. 200529 | SNAQ¥ | Adults Hospital |
– | ✓ | ✓ | Use of ONS or tube feeding | Prompts nutritional intervention |
| Ferguson et al. 199930 | MST | Adults Hospital |
– | ✓ | ✓ | – | Yes |
| Jeejeebhoy et al. 199031 | SGA*** | Adults Hospital |
– | ✓ | ✓ | GI symptoms, functional capacity, underlying disease state, physical exam | No |
*‘Malnutrition Universal Screening Tool’ (‘MUST’) – suitable for use across healthcare settings, see http://www.bapen.org.uk/musttoolkit.html for more information. **Alternative measures and subjective criteria can be used if unable to measure height/weight. †Mini Nutritional Assessment Short-form. MNA fulfils the function of both nutritional screening and assessment. See www.mna-elderly.com for more information. ¥SNAQRC available for use in older people in care homes or residential care and SNAQ65+ for patients in the community aged ≥ 65 years, see http://www.fightmalnutrition.eu/malnutrition/screening-tools/ for more information. ***Subjective Global Assessment.
Use of specific screening tools varies by country, and the ESPEN NutritionDay survey showed that screening was most often performed using locally-developed tools.32 Results from the 2010 British Association for Parenteral and Enteral Nutrition (BAPEN) Nutrition Screening Week in the UK showed that among care homes and hospitals using screening tools, ‘MUST’ was the most common tool used to screen for risk of malnutrition, potentially facilitating continuity of care within and between care settings and the comparison of prevalence rates across countries and settings.33 It is important that the validity of a nutritional risk screening tool is considered when selecting a tool, along with other considerations such as the intended purpose of the tool, reliability and practical aspects of implementation.19,25
 In Children
Growth in infancy and childhood is most commonly assessed by measuring weight-for-height (WFH) and height-for-age (HFA).34 Anthropometric measures are rapid, inexpensive and non-invasive. Malnutrition can also be assessed as thinness (low BMI for age), as described by Cole et al. in 2007, where the thinness cut-off linked to 17 kg/m2 is close to the wasting cut-off based on -2 z-scores.35 However, no single anthropometric measure provides enough information to make a full assessment of nutritional status.34 Regular monitoring and recording of growth measurements help identify any deviations from expected growth patterns. Nonetheless, the use of anthropometric measures alone may underestimate the problem of malnutrition in hospitalised children or children with specific underlying diseases. Anthropometric measures will identify patients who are malnourished but not those who are ‘at risk’ of developing malnutrition.36
On the other hand, clinician evaluation alone has also been shown to be inadequate for accurate assessment of nutritional status and for identification of severe malnutrition.37 In an effort to overcome these issues multi-component screening tools have been developed to identify children at risk of malnutrition, who should then undergo further assessment.
Tools to screen for risk of malnutrition specifically developed for use in children are available (see Table 1.4), and they usually take account of nutritional intake, presence and severity of disease and weight loss, and in some cases, they include anthropometric measures, such as weight, height, BMI and mid-upper arm circumference. In most cases, the results of screening are linked to a care plan, management pathway or recommendations for nutritional intervention.38-44
Summary of components included in nutritional risk screening tools specifically designed for use in children
| Reference | Tool | Age group | Anthropometric measures | Weight loss | Nutritional intake | Other | Linked to action plan |
|---|---|---|---|---|---|---|---|
| Gerasimidis et al. 201038 | Paediatric Yorkhill Malnutrition Score (PYMS) | 1-16 years | ✓ (BMI) | ✓ | ✓ | Acute admission or condition effect on nutrition | Yes |
| Hulst et al. 201039 | STRONGkids Screening Tool Risk of Nutritional Status and Growth | > 1 month | – | ✓ | ✓ | Subjective clinical assessment High-risk disease |
Yes |
| McCarthy et al. 201240 | Screening Tool for the Assessment of Malnutrition in Paediatrics (STAMP) | 2-17 years | ✓ (Height, weight) | Compare with growth charts | ✓ | Diagnosis | Yes |
| Secker and Jeejeebhoy 200741 | Subjective Global Nutritional Assessment (SGNA) for children | 31 days -17.9 years | History from parents | History from parents | History from parents | History of GI symptoms, and functional capacity | Not specified |
| Sermet-Gaudelus et al. 200042 | Paediatric Nutritional Risk Score | > 1 month | – | – | ✓ | Pain Pathological condition |
Yes |
| White et al. 201643 | Paediatric nutrition screening tool (PNST) | 1 month -18 years | – | ✓ | ✓ | Clinical Assessment | Not specified |
| Gerasimidis et al. 201944 | The infant Nutrition Early Warning Score (INEWS) | > 1 year | ✓ | ✓ | ✓ | – | Not specified |
Assessing nutritional status and nutritional risk in children with specific diseases
Specific growth charts have been developed to take account of the differences in expected growth in children with a variety of underlying diseases (e.g. cerebral palsy, Down’s syndrome, Duchenne muscular dystrophy).34 These growth charts can be used in some cases to ensure that a more appropriate assessment of nutritional status is undertaken; however, in cerebral palsy for example, the growth charts are used to plot current growth rather than optimal growth. Screening tools for use in children with specific conditions have also been developed, e.g. cystic fibrosis.45
Different measurement approaches explain at least in part large differences in reported values for malnutrition among different populations.
Measurement approaches in adults
- As described above, measuring frank malnutrition using nutritional assessment techniques differs from screening for nutritional risk; however, in the published literature, prevalence rates reported for ‘malnutrition’ are not always clearly separated in this way.
- While traditional markers like albumin and prealbumin are used to assess nutritional status, their accuracy is limited due to the influence of inflammation, liver function, fluid status and half-life, meaning they may not accurately reflect recent changes in nutritional intake or status. A comprehensive nutrition-focused physical exam and patient history are now considered more crucial for diagnosing malnutrition. Laboratory markers should complement these assessments rather than replace them. Although serum IGF-1 is less affected by inflammation, it lacks the specificity needed for clinical use. Despite these limitations, prealbumin can still offer valuable prognostic insights in severe illnesses and help predict surgical outcomes and mortality.46
- The phase angle (PhA), a bioimpedance analysis (BIA)-derived parameter, was also assessed for malnutrition screening in patients with advanced chronic kidney disease (CKD) awaiting kidney transplantation, using the Global Leadership Initiative for Malnutrition (GLIM) criteria as the reference. Of the 63 patients, 34.9% had malnutrition. A PhA threshold of ≤4.85° showed moderate sensitivity (72.7%) and specificity (65.9%) for detecting malnutrition, with a 3.5-fold increased risk of malnutrition. However, the PhA demonstrated only fair validity compared to the GLIM criteria, indicating it should not be used as a stand-alone screening tool in this population. 47
- The use of anthropometric measures alone may underestimate the extent of nutritional risk. Anthropometric measures will identify patients who are malnourished but not those who are ‘at risk’ of developing malnutrition.
- SGA or studies using nutritional risk screening tools specifically designed for adults and children report higher prevalence rates for malnutrition compared to studies that use anthropometric measures alone (see Section 1.2 – Prevalence of Malnutrition and Tables A1.1–A1.8 in Appendix I).
- Some studies report either acute or chronic malnutrition or an overall figure which is either a simple addition of the two or reflects the use of a different method of screening or assessment which does not distinguish between acute and chronic malnutrition (see Appendix I, Table A1.8).
Measurement approaches in children
- In a study of the prevalence of malnutrition in children on admission to hospital (n = 1571) using the PYMS tool, 46% of the patients at high risk of malnutrition had a normal BMI, illustrating the importance of using a malnutrition screening tool rather than BMI alone to assess malnutrition risk.48 In the Dutch national survey among 424 hospitalised children the same message can be drawn: 8% of the children were scored as high risk, but of these children 47% were malnourished based on assessment of WFH and HFA.39In the Australasian Nutrition Care Day Survey undertaken in 2010 (acute care hospitals in Australia and New Zealand, n = 3122), 18% of the overweight/obese patients in the study (n = 299) (BMI > 25 kg/m²) were assessed as malnourished (Subjective Global Assessment [SGA] B+C categories).49
- In children, although most reports include moderate and severe malnutrition when reporting prevalence figures, some reports include severe malnutrition alone, whilst others include mild malnutrition as well as moderate and severe malnutrition, leading to much higher figures. In other cases, details of the severity of malnutrition are not provided, making comparisons difficult (see Appendix I, Table A1.8).
- It is interesting to note that some studies excluded patients who are likely to be at high risk of malnutrition, in particular studies in children:
- Rocha et al. (2006) reported prevalence rates of between 6.9% and 18.7% (see Appendix I, Table A1.8 for details of classification) in children within 48 hours of admission to hospital. However, they excluded children with chronic liver or renal disease, surgical pathologies or cerebral palsy and children who were admitted to intensive care or oncology units during the study period.50
- Hankard et al. (2001) reported a prevalence rate of 20% (BMI z-score below -2 SD, 12% when patients with anorexia nervosa were excluded) in children admitted to medical, psychiatric or surgical wards. The study design excluded patients receiving nutritional support, who represented 19% of the total number of patients admitted on the day of the survey. As these patients were receiving nutritional support, their nutritional status would be expected to be good if the treatment was adequate and effective; however, they would also most likely reflect the patients with a diagnosis which would place them most at risk of malnutrition.51 Gerasimidis et al. excluded paediatric patients from cardiology, renal, orthopaedics and critical care.38
- An Italian study of all children aged 1 month to 16 years admitted to a medical paediatric ward with Grade 1 conditions involving mild stress factors, such as admissions for diagnostic procedures, minor infection or minor surgery, reported a prevalence rate of 10.2% (BMI z-score below -2 SD). The study provides valuable data in this group of patients, but it should be used with care as patients with a hospital stay of > 72 hours and patients with chronic conditions were excluded.52
Where possible in this report, the term malnutrition is defined in relation to specific studies
Stratton et al. recommend that wherever the terms ‘malnutrition’ or ‘at risk’ of malnutrition are used, they should be defined or explained.53 In practice, these terms and nutritional risk are often used interchangeably.
Where available, this report includes information on the type of screening test used, the criteria used to define nutritional risk/malnutrition, the patient groups and the clinical setting as reported in original texts to help to avoid confusion. In many cases, this information is included in the detailed tables in the Appendices.
Malnutrition is more than just weight losss
- Skeletal muscle loss should be a key focus in malnutrition screening, as it is a significant form of malnutrition, not just weight loss. Early detection of muscle loss, particularly in high-risk populations, is essential for effective intervention. Screening for malnutrition should include assessments of muscle mass alongside traditional nutritional evaluations, as muscle loss is a major risk factor for sarcopenia. In addition to muscle mass, muscle strength and muscle-specific strength were found to be accepted components of sarcopenia. All methods for measuring muscle mass are indirect, and there is no consensus in the literature on the most accurate technique. However, dual X-ray absorptiometry (DXA) has been identified as a reference standard. Regarding muscle strength, measurement methods include handgrip strength and the chair stand test.A comprehensive approach that integrates both nutrition and physical exercise is vital to prevent and treat muscle loss and malnutrition.54-56
- Abnormalities or deficiencies of specific micronutrients (vitamins, minerals and trace elements) are frequently associated with malnutrition.2 However, micronutrient deficiencies will not be identified when screening for nutritional risk but should be taken into consideration during nutritional assessment and when planning nutritional care.
- Vitamin D deficiency is one of the most common nutrient deficiencies among older people.57,58 Low vitamin D levels (< 20 ng/ml) have been found in nearly 50% of independent community-dwelling older men and women.59
- Research findings in targeted population groups indicate that vitamin D deficiency is prevalent in 57% of medical inpatients, 49% of patients admitted to sub-acute rehabilitation facilities, and 23% (12% deficient, 11% severely deficient) of patients with gastrointestinal (GI) disease.60-62
- Poor status of a range of micronutrients has been reported in the UK National Diet and Nutrition Survey (people aged 65 years and over), for example:63
- 40% of older people (both free-living and institutionalised) had low biochemical status of riboflavin;
- 40% of older people living in institutions and 15% of free-living older people had low status of vitamin C and folate;
- 52% of older men and 39% of older women living in institutions had haemoglobin levels below the WHO cut-off for anaemia (13.0 g/dl for men and 12.0 g/dl for women);
- 15% of older men and 7% of older women living in institutions had plasma zinc concentrations below 10 μmol/l indicating zinc deficiency.
- Plasma zinc and selenium levels below reference levels have been observed in hospitalised older patients with hip fractures and older people attending day care centres in the UK.64
Malnutrition still goes undetected and untreated across healthcare settings
 Hospital inpatients
Hospital-acquired malnutrition (HAM) often goes unnoticed despite advancements in identifying those at risk of malnutrition at admission. A review analysed 12 studies involving 35,324 hospitalised adults. The pooled incidence of HAM in acute care was 25.9%, with higher rates in prospective studies (9–38%) than retrospective ones (<1.4%). The findings highlight the need for standardised diagnostic criteria. 65
- As many as 40% of patients found to be at risk of malnutrition in a Danish hospital had not been screened for nutritional problems.66
- Rasmussen et al. (2004) found that nearly 40% of patients in Danish internal medicine, GI and orthopaedic surgery departments were at nutritional risk, and that two-thirds did not have a nutrition care plan or monitoring of dietary intake.67
- A prospective study of 395 newly admitted patients to general medical wards in a Dutch hospital revealed that nutritional assessment and intervention were not sufficiently applied by any professional (doctor, medical student, nurse) at any stage of the pre-, actual- and post-hospitalisation period.68
- A study in a major tertiary teaching hospital in Australia found that despite 30% of patients being identified as malnourished and 61% at risk, there was poor documentation by staff of two key risk factors (recent weight loss in 19% and appetite in 53% of cases), and even poorer evidence of referral for dietetic assessment in these cases (7% and 9% respectively).69
- A cross-sectional survey of 2,094 patients in 140 Belgian hospital wards for older people found a suboptimal implementation of nutritional care practices, such as:70
- 56% of wards did not undertake nutritional screening or assessment at admission;
- 86% of wards did not have a nutrition protocol;
- only 31% of wards used a standardised nutritional screening tool.
- In one UK hospital, only 69% of patients were screened for malnutrition on admission, with only 45.2% of high-risk patients appropriately referred to dietetic services. In almost 40% of high-risk cases, no action was taken.71
- In the 2011 UK Nutrition Screening Week Survey, most hospitals reported that in spite of a screening policy being in place (99%), weighing (assessment of body weight on admission) on all wards was carried out in only 67% of the hospitals surveyed, although this has improved from 49% in 2007 (Figure 1.5).72
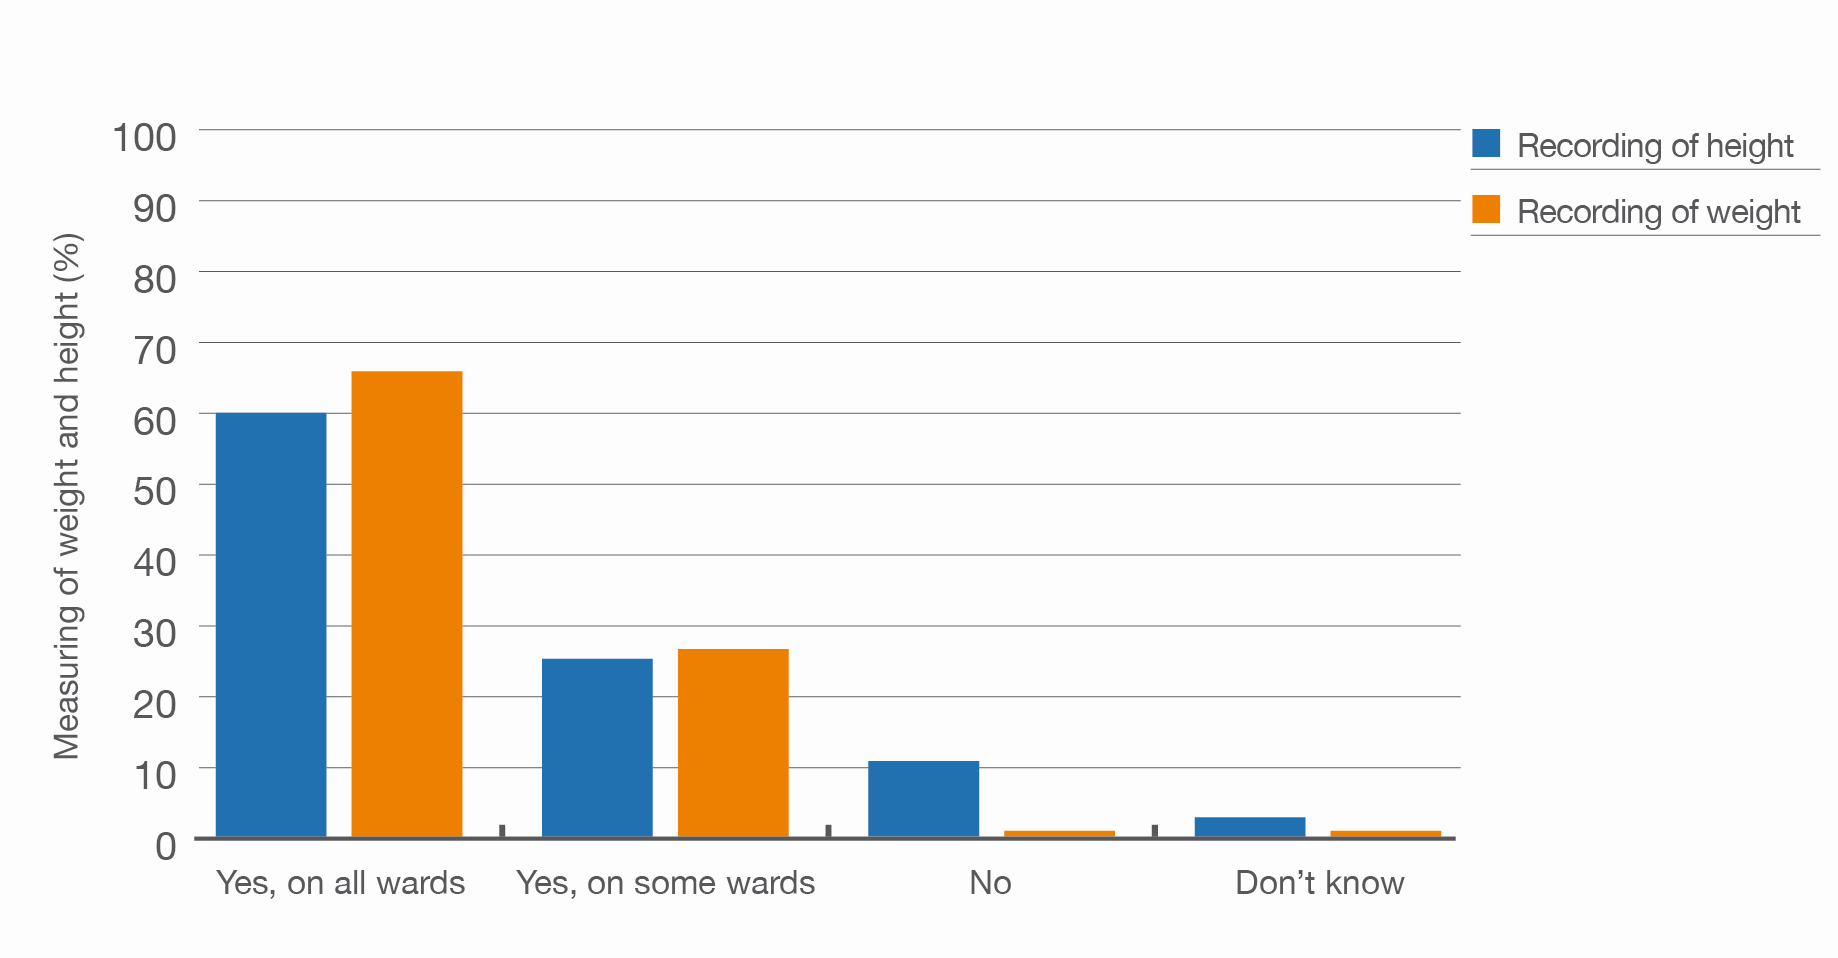
Measurement of height and weight in UK hospitals participating in the National Nutrition Screening Week Survey in 2011 (adapted from Russell & Elia 2012)33
- A prospective cohort study of newly admitted adult patients (18–74 years of age) to an acute tertiary hospital in Singapore found that only 3 of the 235 malnourished patients (SGA B+C) were coded as such, illustrating that the majority of malnourished patients are either not recognised or that the presence of malnutrition is not documented.73
- An analysis of over 1.5 million patients from the Minimum Basic Data Set from Spanish hospitals identified only 1.4% with malnutrition, a much lower prevalence than in published studies within Spanish hospitals and hospitals in other countries across the world (see Table 1 in Appendix 1, Figure 1.9); the authors suggested that this low number was due to low communication of malnutrition in discharge reports.74
- A retrospective analysis of data from 2013 and 2014 from the department of internal medicine from a university hospital in France (8541 hospitalisations, mean age 72.8±16.5 years) revealed that although the practice of nutritional screening (using NRS-2002) significantly increased (16.5% in 2013 v. 41.9% in 2014 [p<0.001]) less than half of patients identified as ‘at-risk’ of malnutrition actually received any nutritional management and that the proportion of ‘at-risk’ patients who received nutritional intervention decreased from 2013 to 2014 (46.9% v. 40.3% [p<0.05]).75
 The community
Implementing nutrition interventions after identifying malnutrition is essential to addressing the nutritional needs. Early and accurate diagnosis using validated tools, such as MNA, SGA, and PG-SGA, enables dietitians to develop personalized care plans. Nutrition strategies, including ONS, food fortification, and home-delivered meals, play a crucial role in improving nutritional status and overall well-being. Ensuring timely and appropriate intervention can prevent further health decline and promote better health outcomes. Where dietitians are unavailable, consulting them remains vital to delivering safe and effective nutrition care.76
- Malnutrition affects up to 10% of older adults living in the community and contributes to mortality and morbidity. 77
- In a multi-centre survey of hospital outpatients in the Netherlands (n = 2288; 9 hospitals), only 17% of severely malnourished patients and 4% of moderately malnourished patients were referred to a dietitian.78
- In a Dutch study, nutritional interventions were applied in fewer than half of the malnourished patients identified across hospitals, nursing homes and patients receiving care in their own home. In fact, only 20% of patients in their own home received appropriate nutritional care.79
- In a large international multi-centre study (n = 3248; 49 care homes), despite screening on admission (undertaken more frequently in German [94%] than Dutch [88%] and Austrian [86%] care homes), fewer than 50% of all of the residents identified as malnourished received nutritional interventions (Germany 46%, Austria 40% and the Netherlands 46%).80
- An audit of the use of ONS in care homes in the south of England (n = 1176, 43 care homes) found that most residents identified as at risk of malnutrition did not receive ONS in the 4 weeks prior to the audit and none were under the care of a dietitian (39% of residents malnourished [medium and high risk], 8.2% of all residents received ONS). Further work is needed to establish whether other forms of nutritional support are used.81
- A cross sectional study of nutritional care in 19 care homes (n = 703; mean age 84 [range 27-104 years]) in Peterborough in the UK showed that although 32% were found to be at risk of malnutrition (‘MUST’ 13% medium + 19% high risk) the majority (64%) of patients at high risk were not receiving any form of nutritional support including food fortification, ONS or dietetic care.82
- In a community hospital in Germany, 75% of patients who were judged by the attending physician to be malnourished did not receive nutritional support.83
- The medical records of malnourished patients in The Health Improvement Network (THIN) database (actual health record data from a representative range of National Health Service [NHS] General Practitioner [GP] practices across the UK) showed that only 35.5% of malnourished patients received some form of nutritional intervention (meaning that two–thirds received no intervention despite having been identified as malnourished).84
- In a study designed to describe the use of ONS in 926 nursing homes (n=23,689 residents aged ≥65 years) from 19 countries (96.3% from Europe, 3.7% from North America) participating in the nutritionDay project (cross sectional multicentre survey) only 42% of malnourished residents (nursing staff estimated nutritional status) received oral nutritional supplements (ONS) and only 1 in 3 (33%) of residents with low Body Mass Index and 1 in 5 (22%) of residents with previous weight loss received ONS.85
Malnutrition is often undetected and untreated in children
Malnutrition in hospitalised children is often overlooked across Europe, despite its impact on health outcomes. A study involving six countries found only 23% of paediatric specialists routinely used nutritional screening tools, with higher rates in Belgium, the Netherlands, and the UK (40–50%).86
- Pawellek et al. (2008) found that almost 25% of children admitted to a paediatric hospital in Germany did not have combined height and weight data recorded, hampering efforts to identify children at risk of malnutrition.87
- A pilot study for The Children’s Nutrition Survey examined the current nutrition and dietetic practices in paediatric centres across the UK and Ireland (n = 27; 7 specialist paediatric hospitals and 20 district general/single wards) and found that:88
- most centres reported that they were not using a nutrition screening tool;
- although the majority of centres measured weight on admission (> 85%), measurement of height was infrequently undertaken in hospitals with a nutrition support team/nutrition steering committee, and it appeared that it was not measured in hospitals without such a team (31% vs 0%) (see Figure 1.6).
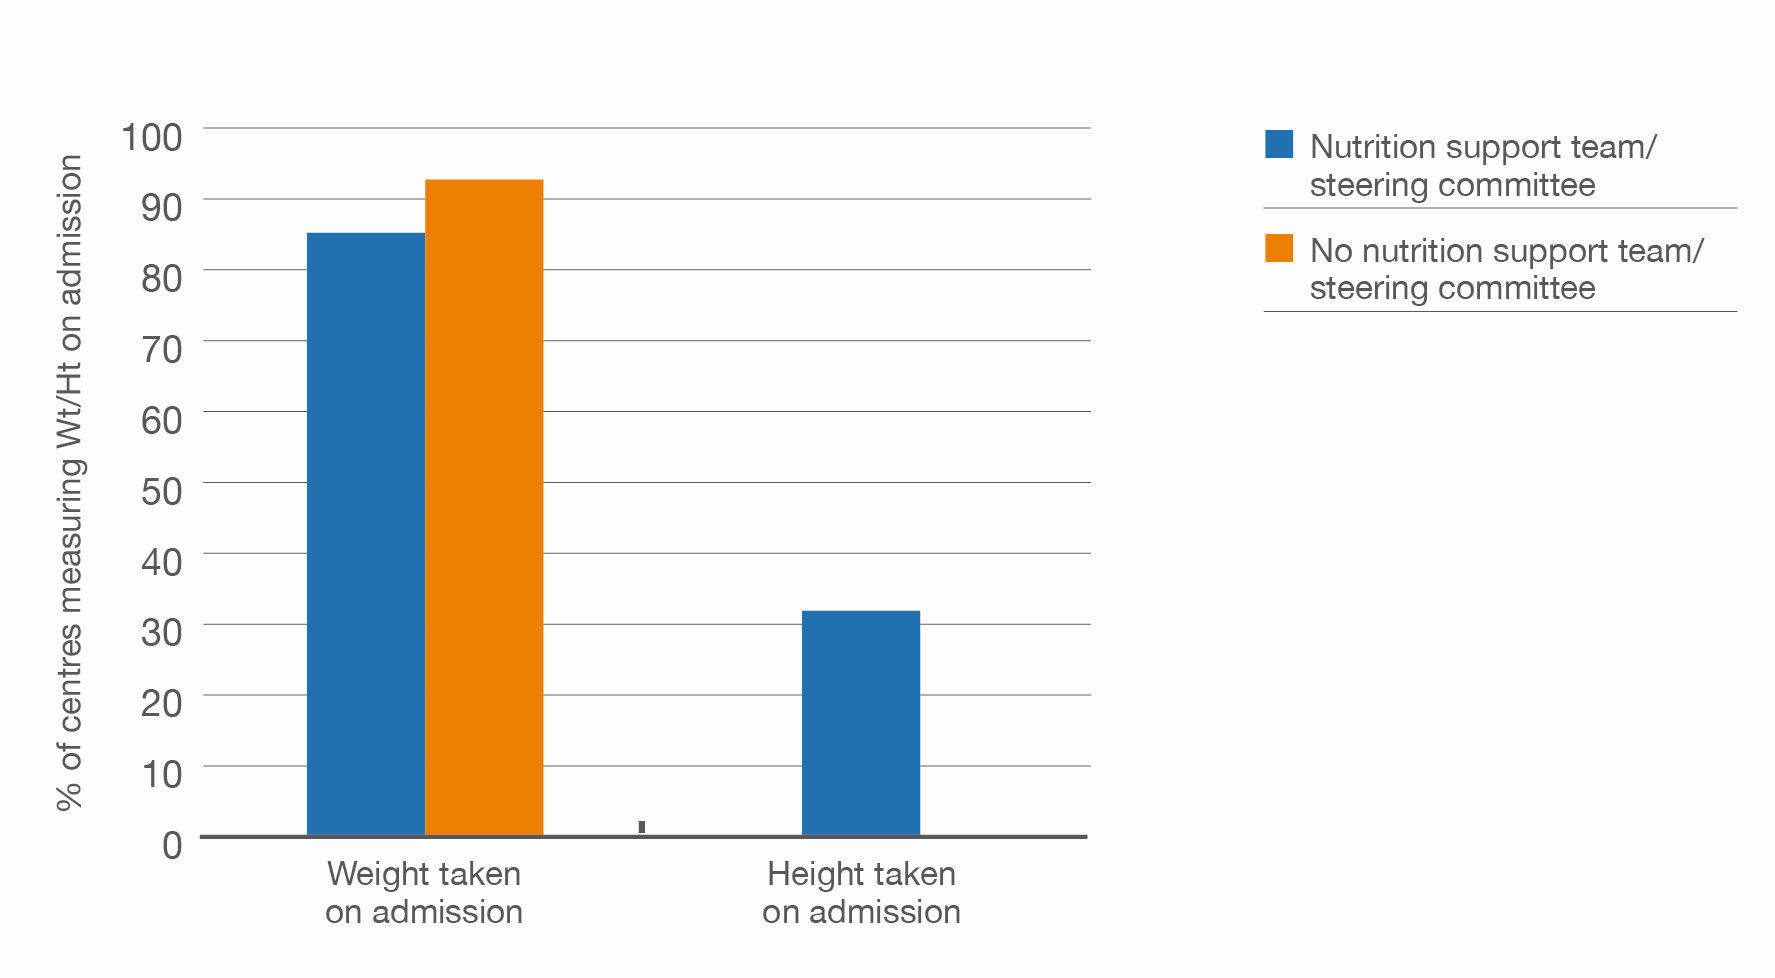
Nutrition-related practices in paediatrics throughout the UK and Ireland: results for measurement of weight and height on admission (adapted from Carey et al. 2010) (adapted from Carey et al. 2010)88
- In France, a study of the prevalence of malnutrition in hospitalised children aged between 2 months and 16 years (n = 280) showed that only 30% of malnourished children were identified.89
- Only 50% of children identified as malnourished in a cross-sectional survey in France had been referred to a dietitian on the day of the study.51
- A cross-sectional analysis undertaken at the time of enrolment of children and adolescents with Crohn’s disease in a trial of initiating therapy with either thiopurine or infliximab established that 36% of severely underweight patients did not receive a multi-vitamin supplement, supplemental formula or tube feeding.90
Inconsistent nutrition-related practices are widespread in centres that care for children
- A pilot study for The Children’s Nutrition Survey examined the current nutrition and dietetic practices in paediatric centres across the UK and Ireland (n = 27; 7 specialist paediatric hospitals and 20 district general/single wards) and found that:88
- less than half (48%) had a nutrition support team or nutrition steering committee;
- only 6 centres (22%) routinely included nutrition-related information in the discharge plan;
- audits of nutrition practices, implementation of referral criteria, and staff training on nutrition topics were not consistently undertaken across centres (see Figure 1.7).
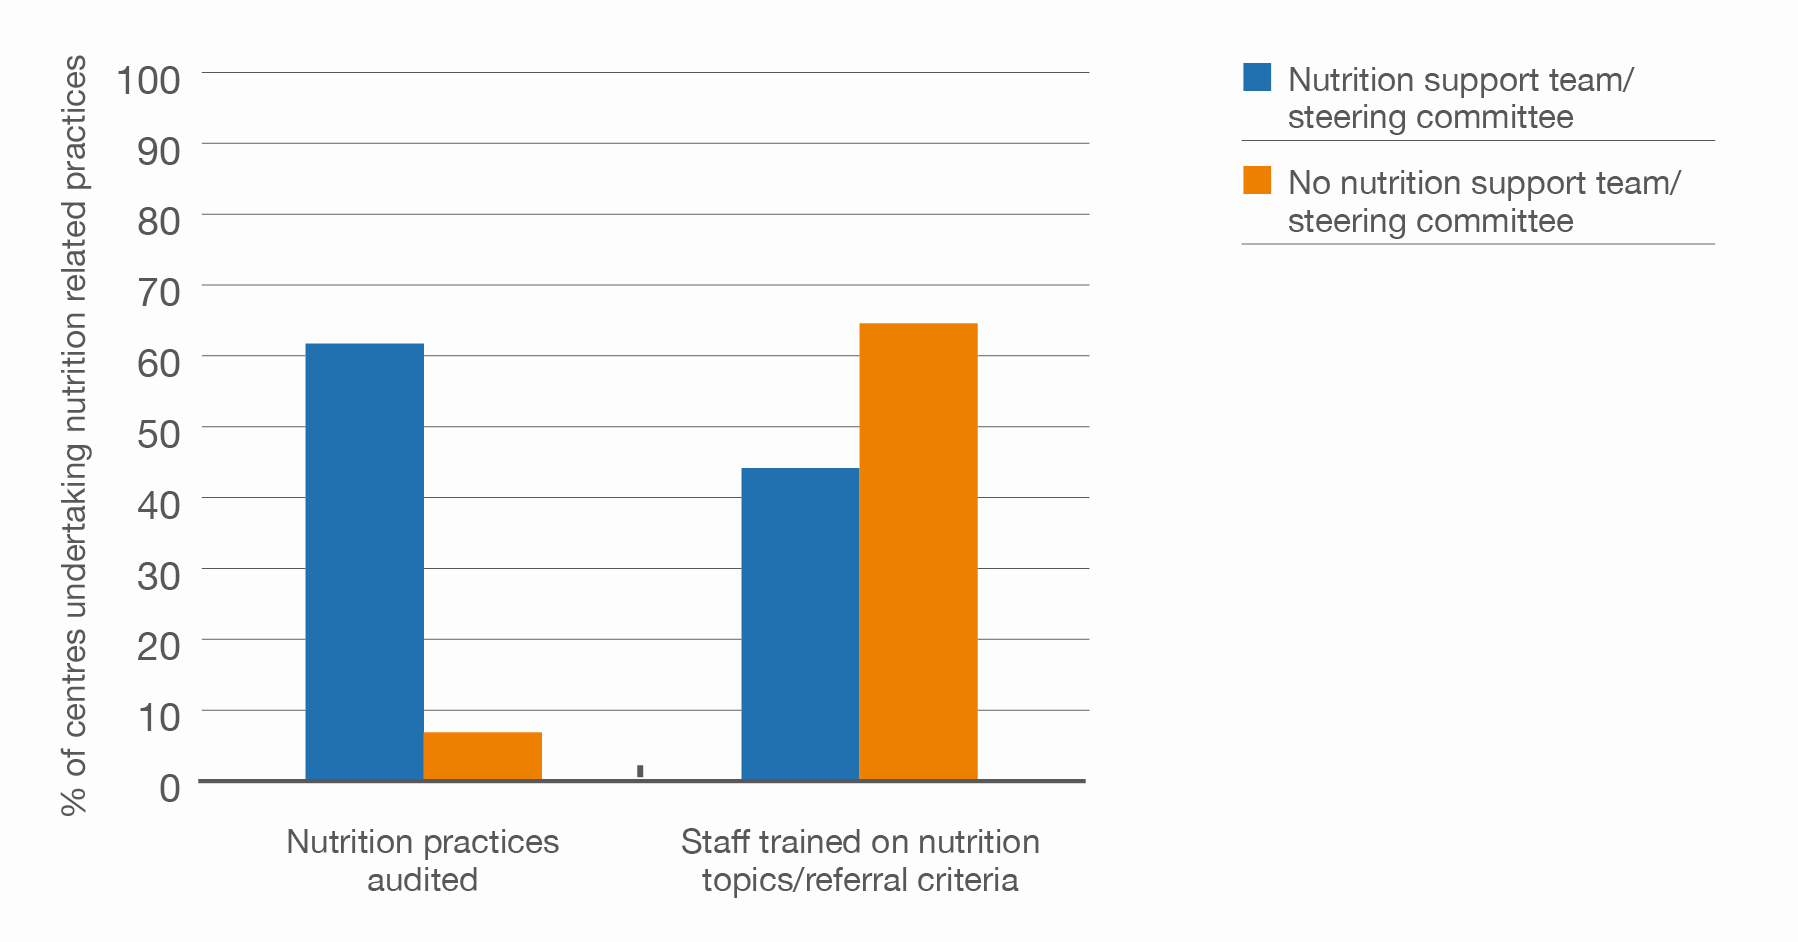
Nutrition-related practices in paediatrics throughout the UK and Ireland (adapted from Carey et al. 2010)88
- A nationwide survey (USA) of 125 institutions (54% response rate) found no consistency in the provision of nutritional services in paediatric oncology, a group of patients at high risk of malnutrition. Many institutions fail to undertake nutritional assessments at critical time points during care, do not use screening tools to identify patients at risk of malnutrition, and have no criteria for intervention (see Figure 1.8).91
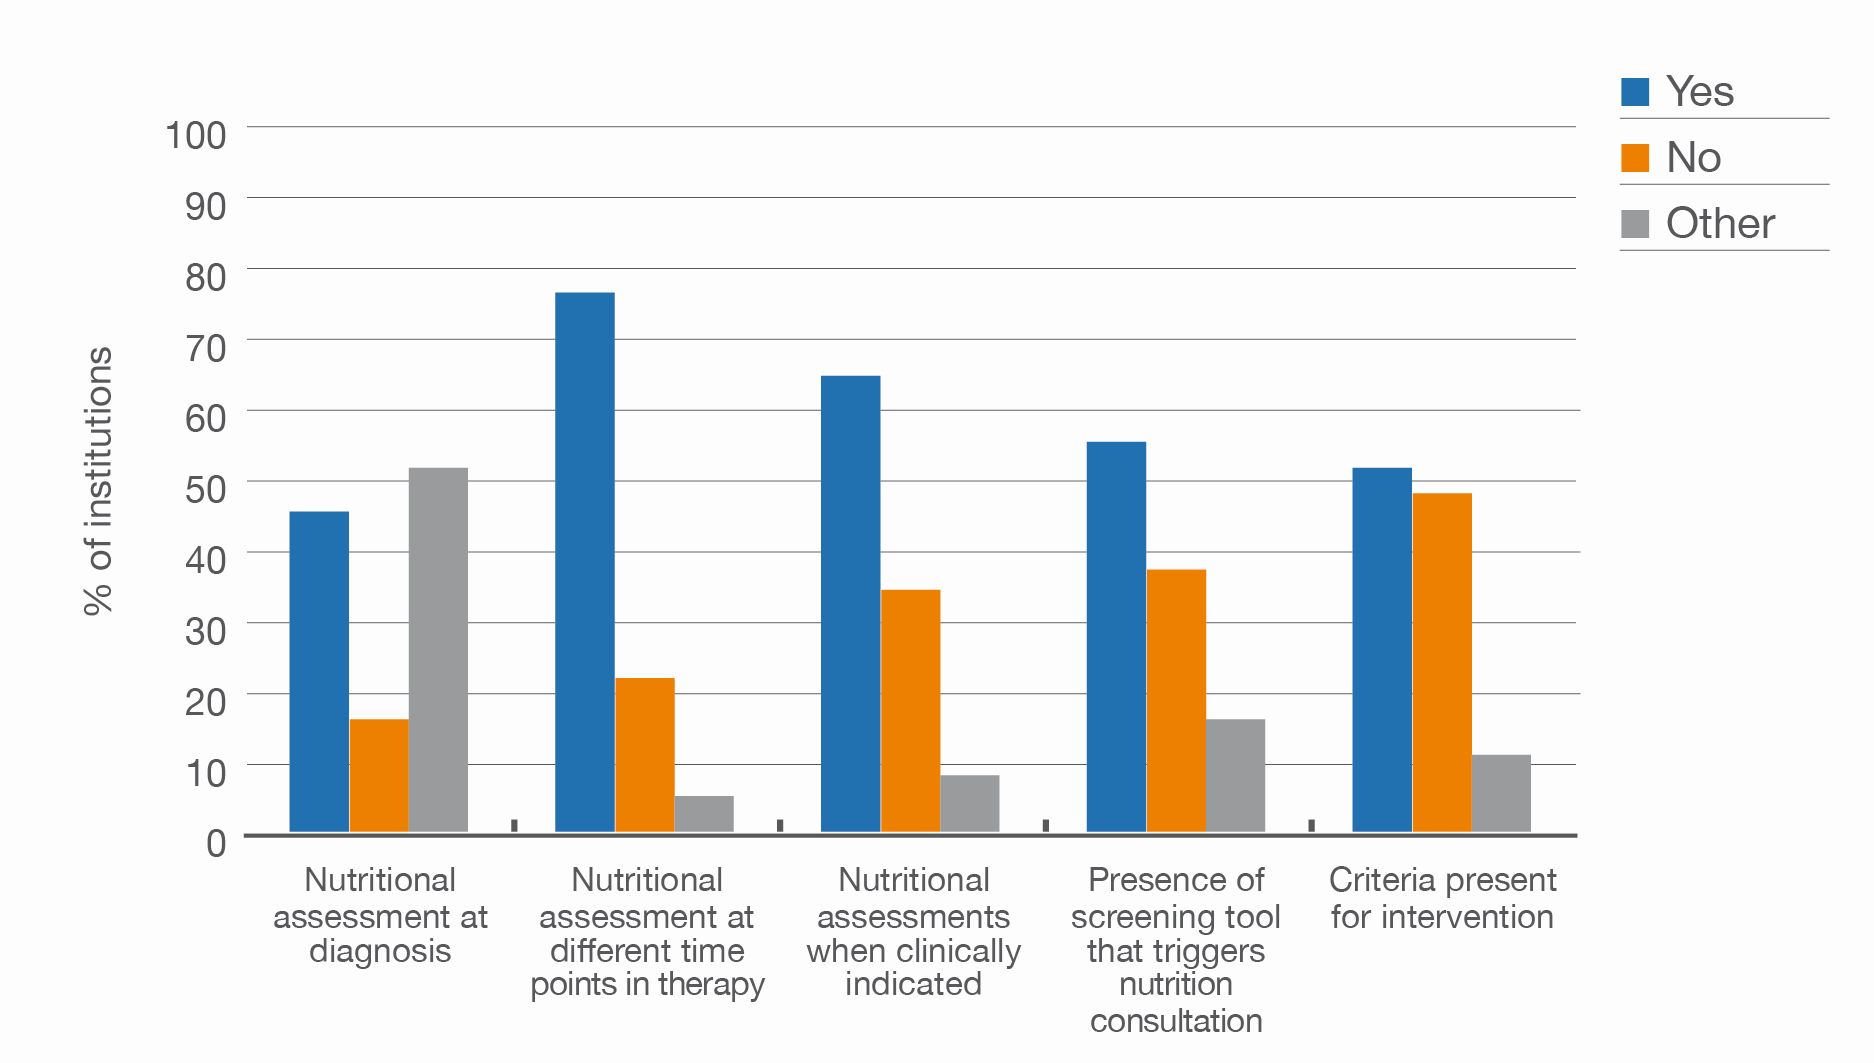
Standards of nutritional care in paediatric oncology: results from a nationwide survey (adapted from Ladas et al. 2006)91
A clinical audit conducted at the Royal Hospital for Sick Children (RHSC) in Edinburgh across three settings (inpatient, day-care, outpatient) revealed inconsistencies in the provision of nutritional care for paediatric cancer patients, a group highly vulnerable to malnutrition. Several critical areas showed less than 70% adherence to established nutritional standards, including anthropometry documentation, malnutrition screening, and assessments of serum vitamin and hormone levels. Key issues included failure to perform malnutrition screenings at crucial stages of care, insufficient use of screening tools, and incomplete or inconsistent nutritional biochemical assessments, highlighting significant gaps in the current practices at RHSC. 92
Continuity of care
- The UK Nutrition Week Survey undertaken in winter 2010 also highlighted that although the results of screening were linked to a care plan in 9 out of 10 hospitals surveyed, less than half always or usually included nutritional information in discharge letters, potentially affecting continuity of nutritional care.93
Between 20% and 50% of hospital inpatients are affected by malnutrition upon admission, and further worsening is expected throughout their hospitalisation.94 Only 11% consulted a dietitian post-discharge, and this was linked to severe malnutrition, weight loss, comorbidities, and prior hospital consultations. These figures highlight the need for continued nutritional support after discharge. 95
In the More-2-Eat study, 513 patients were recruited from five medical units across Canada, with 48.5% (249 participants) completing a 30-day post-discharge telephone interview. The study found that 42% (110 patients) received nutrition recommendations at hospital discharge, and 65% (71/110) followed them. 96
To that end, nutrition assessment following screening is used to identify nutrition-related problems, including malnutrition and their underlying causes. There are four main diagnostic tools for adult malnutrition: the Subjective Global Assessment, Mini Nutritional Assessment, the Academy of Nutrition and Dietetics/American Society for Parenteral and Enteral Nutrition malnutrition consensus characteristics, and the Global Leadership Initiative on Malnutrition criteria. These tools provide frameworks to help clinicians diagnose malnutrition effectively. While there is considerable overlap in the criteria of these tools, a key objective is to create a unified data set that can be used globally to assess malnutrition prevalence and evaluate the effectiveness of nutrition interventions on both nutritional and clinical outcomes. 97