
1.2.1 Hospital
 One in four adult hospital patients is malnourished or at risk of malnutrition99
- Despite differences in the age of subjects, there is consistent and overwhelming evidence that malnutrition is a widespread problem in hospitals across the world and that it is highly prevalent in affluent and developed societies (see Table A1.1 in the Appendix) (see Figure 1.9). Variation in prevalence figures may in part reflect the different methods that exist to detect malnutrition risk. Current challenges include limited nutritional screening, poor referral systems, and the distinct disease burden faced by hospitals, emphasizing the urgency for routine screening in different settings.100
- The current data still support the fact that malnutrition is a prevalent issue among hospitalised adults, with significant consequences for patient outcomes. A recent systematic review found that approximately 20-50% of hospitalised adults face malnutrition or are at high risk, with higher rates in populations with complex conditions, such as those with COVID-19. Specifically, one meta-analysis estimated malnutrition or high malnutrition risk in hospitalised patients at around 52%, suggesting this issue has likely intensified in recent years as healthcare systems manage an aging population and increasing chronic diseases.99,101 Large-scale multi-centre surveys (n > 5000 in each study) show that about 1 in 4 (18–34%) adult hospital patients are malnourished or at risk of malnutrition32,72,93, (see Table 1.5). In the winter 2010 UK Nutrition Screening Week Survey a prevalence of 34% was found in adult patients admitted to hospital; this higher figure may be related to a number of reasons, including a higher prevalence of malnutrition in patients with respiratory disease.93
- The 2020 Malnutrition Awareness Week Survey in the UK showed a prevalence of 40% was found in adult patients admitted to hospital.106 Similarly, a scoping review on adult hospital malnutrition in Africa revealed malnutrition rates between 8% and 85% among hospitalised patients, underscoring the widespread and diverse nature of malnutrition globally. 100
- The nutritionDay Survey undertaken by 1,217 units from 325 hospitals in 25 countries (Europe and Israel; data collected on a single day in 2007 and 2008) included 21,007 adult patients and found that 27% of patients were classified as being at risk of malnutrition.32 Similar results were found in the Australasian Nutrition Care Day Survey undertaken in 2010 (acute care hospitals in Australia and New Zealand, n = 3122), where 32% of adult hospital patients were found to be malnourished (combined number of malnourished patients identified by SGA [B+C categories] and BMI < 18.5 kg/m2).49
- In 2015, the nutritionDay project assessed the nutritional status of 649 European hospital units across 25 countries and reported a malnutrition prevalence of 12.9% in the European reference group (10,863 participants), with 9.4% in Polish hospital wards (498) based on ESPEN’s 2015 diagnostic criteria.107 Supporting this global phenomenon, the U.S.-based nutritionDay survey (2009–2015) found that 32.7% of 9,959 adult hospital patients were at risk of malnutrition, with inadequate food intake significantly increasing mortality risk.108 Similarly, in Latin America, a regional nutritionDay survey conducted from 2009 to 2015 across ten countries reported 39.6% of hospitalised patients at malnutrition risk.109 These studies highlight the urgent and widespread need for improved nutritional care in acute settings.
- In smaller studies, rates of malnutrition and risk of malnutrition of up to 90% have been reported in adult hospital patients (see Table A1.1 in the Appendix) (see Figure 1.8). Data from the Healthcare Cost and Utilisation Project (HCUP) statistical brief show that in 2013 nearly 2 million U.S. hospital inpatient stays involved malnutrition representing 7.1% of a total of nearly 28 million non-maternal and non-neonatal stays. The majority (63.9%) of the malnutrition-related stays were categorised as ‘protein-calorie malnutrition’.110
- In 2018, malnutrition accounted for 13% of aggregate U.S. hospital costs, exceeding $58 billion.111 Similarly, in 11 Asian countries, hospital malnutrition imposed an additional $30.1 billion annually, primarily driven by prolonged lengths of stay and increased antibiotic use, with 77.2% of costs linked to extended ward stays and 11.5% to ICU stays.112
Malnutrition remains a persistent and costly issue in hospitals, with rates showing a worrying trend upwards in recent years, especially among patients with complex conditions like COVID-19. Current data suggest that between 20% and 50% of hospitalised adults are malnourished or at risk, with large surveys indicating that 1 in 4 to 1 in 3 patients now face malnutrition risk. Studies reveal this burden is increasing, particularly as healthcare systems manage an aging population and rising chronic disease rates, underscoring the need for standardised screening and better nutrition care in hospitals and discharge into the community.
Summary of large-scale studies of the prevalence of malnutrition and the risk of malnutrition in adult hospital patients (n > 5000)
| Country / Region | Author (year) | Patients (n) | Timing of nutritional assessment / screening (data collection) | Prevalence % | Method of assessment / screening |
|---|---|---|---|---|---|
| Europe and Israel | Schindler et al. (2010)32 | 21007 | One day, cross-sectional (single day in 2007 & 2008) | 27 | Variety of tools used, including NRS-2002, ‘MUST’, national or local tools |
| Switzerland | Imoberdorf et al. (2010)103 | 32837 | On day of admission | 18.2 | NRS-2002 |
| The Netherlands | Meijers et al. (2009)102 | 8028 | Cross-sectional, point prevalence of specified day | 23.8 | Based on BMI, weight loss and food intake* |
| UK | Russell & Elia (2012) 72 | 7657 | Within 72 hours of admission (spring 2011) | 25 | ‘MUST’ |
| UK | Russell & Elia (2011) 93 | 9669 | Within 72 hours of admission (winter 2010) | 34 | ‘MUST’ |
| UK | Russell & Elia (2009) 105 | 5089 | Within 72 hours of admission (summer 2008) | 28 | ‘MUST’ |
| UK | Russell & Elia (2008) 104 | 9336 | Within 72 hours of admission (autumn 2007) | 28 | ‘MUST’ |
| Europe | Ostrowska (2021) 107 | 10863 | Cross-sectional, point prevalence of specified day | 12.9 | ESPEN diagnostic criteria |
| US | Sauer et al. (2019) 108 | 9959 | Cross-sectional, point prevalence of specified day | 32.7 | MST |
| Latin America | Correia (2021) 109 | 14515 | Cross-sectional, point prevalence of specified day | 39.6 | MST |
*(see Appendix I, Table A1.1 for full details)
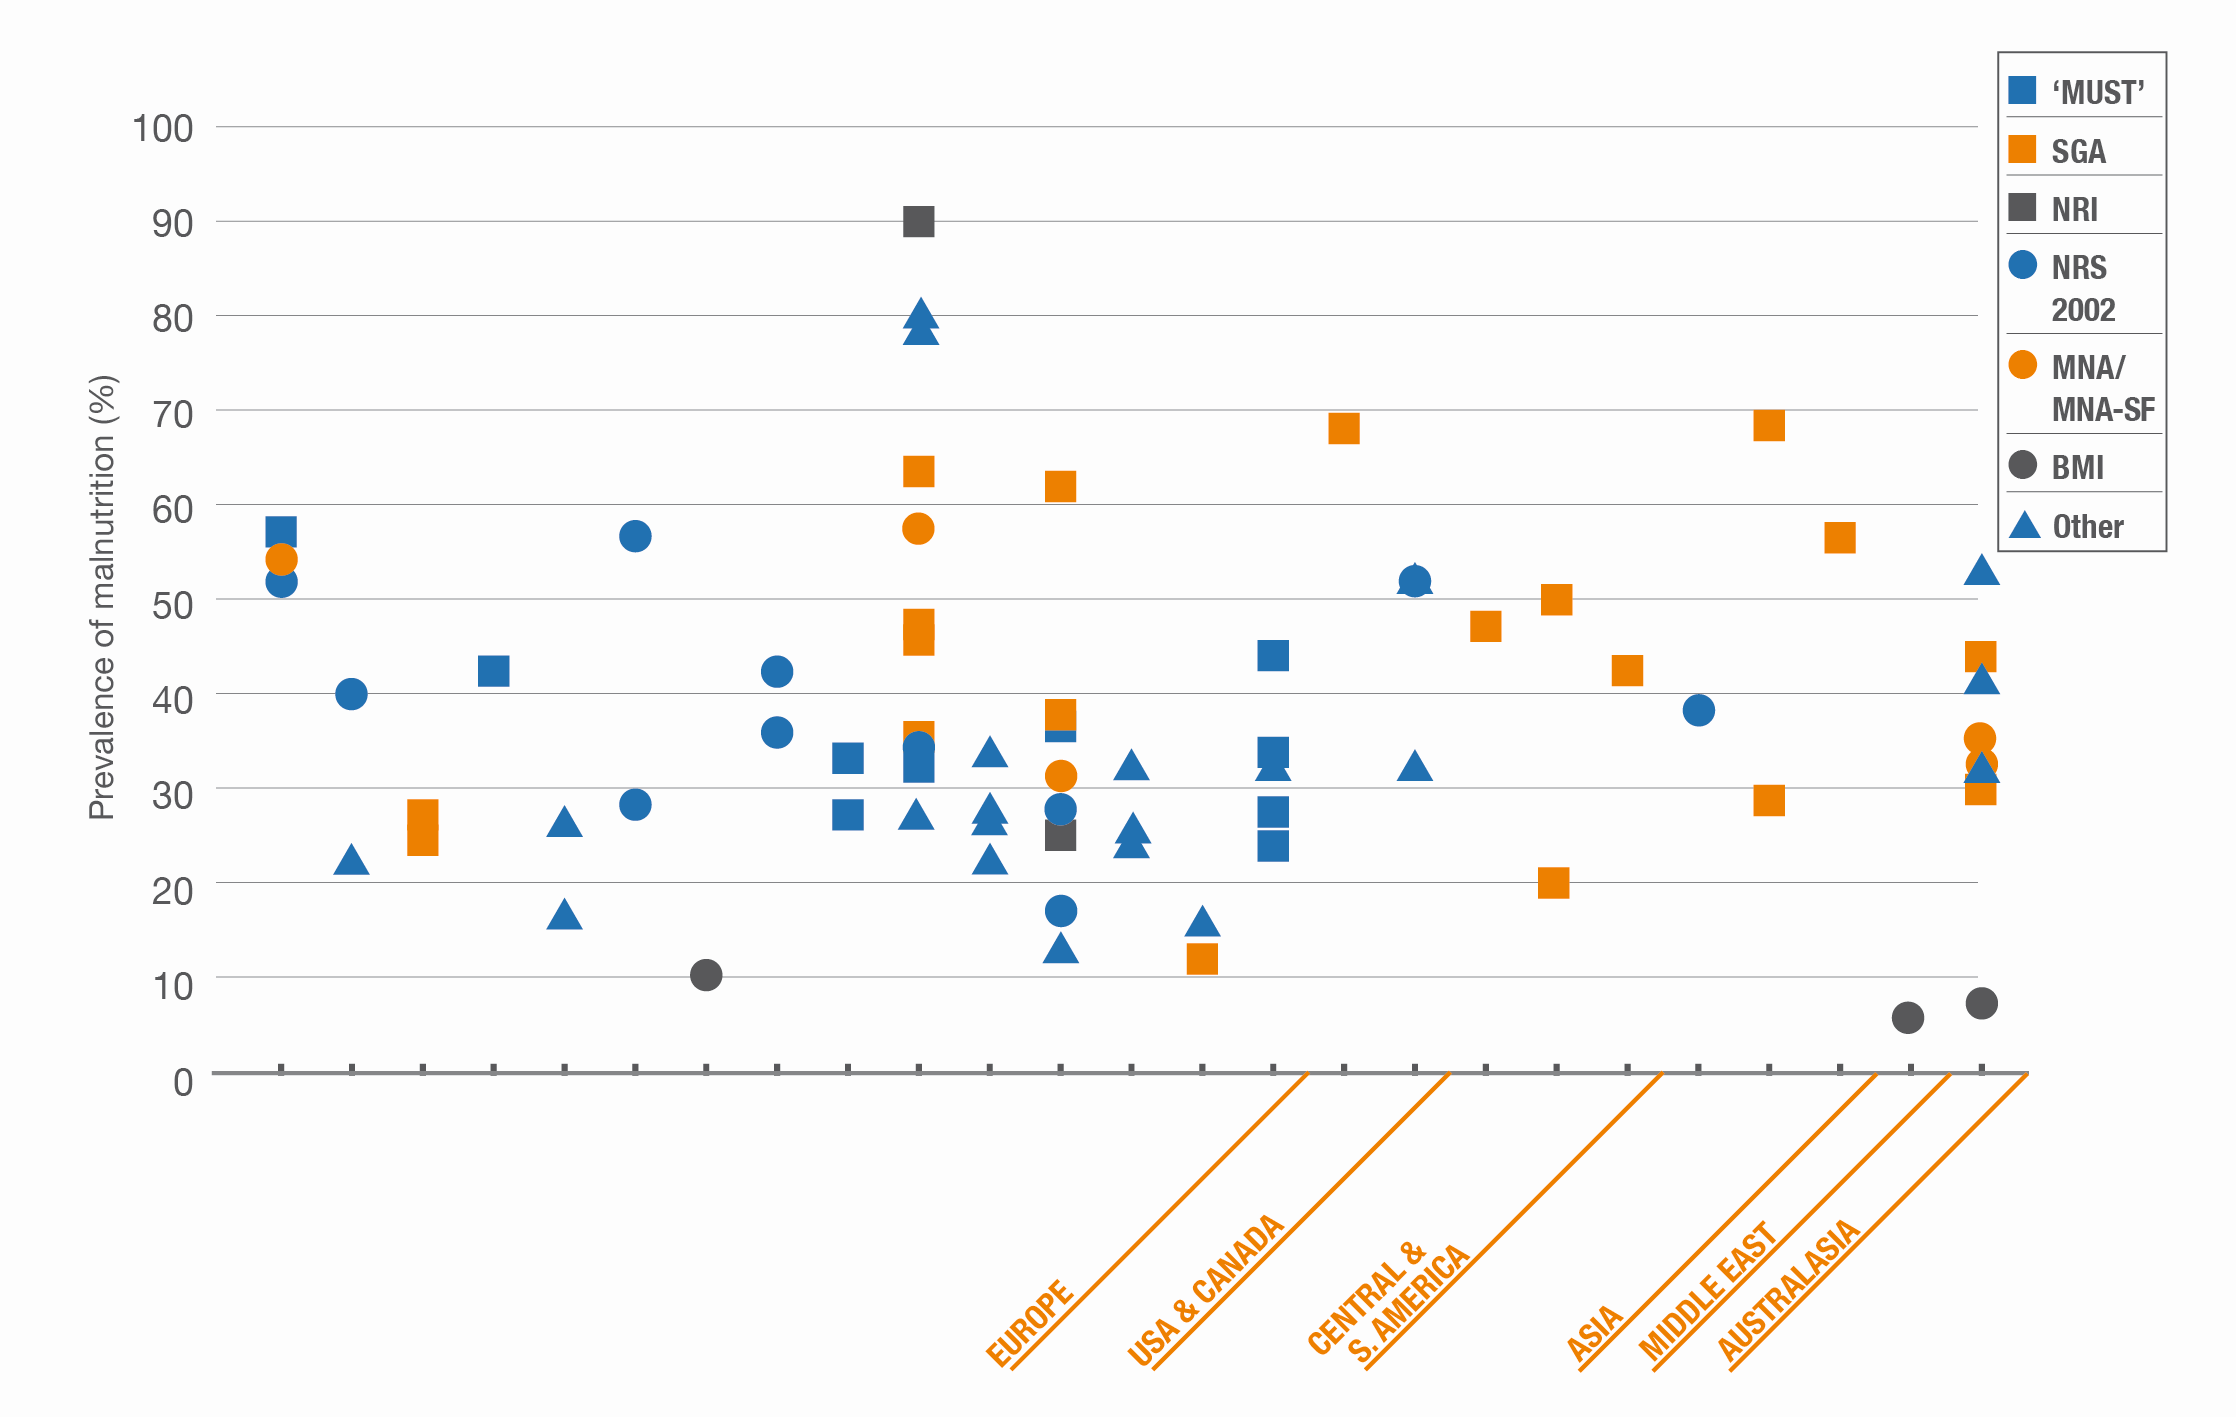
Prevalence of malnutrition risk in adult hospital patients using different screening methods by country and world region (see Appendix I, Table A1.1 for full details)
- Data from the Healthcare Cost and Utilisation Project (HCUP) statistical brief show that in 2013 nearly 2 million U.S. hospital inpatient stays involved malnutrition representing 7.1% of a total of nearly 28 million non-maternal and non-neonatal stays. The majority (63.9%) of the malnutrition-related stays were categorised as ‘protein-calorie malnutrition’.110
 Older people are at significantly higher risk of malnutrition
- Malnutrition affects all age groups but increasing age is associated with an increased risk of malnutrition.72,93 Older people are vulnerable to malnutrition, with prevalence rates 1.2 to 2.3 times higher than in younger patients upon hospital admission, according to studies using SGA24 as they often have several co-morbidities that are often chronic and progressive.122 In the UK Nutrition Screening Week Survey in 2011, the risk was 30% greater in patients aged 65 years and over than in those aged under 65 years (28% vs 21%, p < 0.001).72
One in three older people in hospital are malnourished or are at risk of malnutrition
- The prevalence of malnutrition and risk of malnutrition is high in older people in hospital (see Table A1.2 in the Appendix, Figure 1.10). In some studies, depending on the ward or method used, over 90% of older people were found to be malnourished or at risk of malnutrition.69,70,83,123
- Large-scale surveys (n > 1000) show that about 1 in 3 older people in hospital are malnourished (38.7%)124 or are at risk of malnutrition (22–47.3%)70,124 (see Table 1.6).
- In an Italian study, older hospital patients with mild cognitive impairment (MCI) (n = 65) and dementia (n = 84) were more likely to be malnourished than those with no cognitive impairment (NoCI) (n = 439) (dementia 59.5% vs NoCI 15%, p < 0.001 and MCI 44% vs NoCI 15%, p < 0.001).125
- A systematic review and meta-analysis of studies examining the prevalence of malnutrition in older people in the hospital setting (n = 66) (malnutrition was identified using the Mini Nutritional Assessment (MNA®) criteria), showed a prevalence of malnutrition (MNA <17 points) of 22% (95% CI, 18.9-22.5) and a prevalence of risk of malnutrition (MNA 17-23.5 points) of 45.6% (95% CI, 42.7-48.6). The authors highlighted that there was significant heterogeneity in individual study results.126
- A prospective cohort study across six hospitals in the republic of Ireland, found that among older adults (aged 70+), 18% were malnourished and 45% were at risk of malnutrition upon admission, based on MNA–SF scores. Malnutrition was particularly prevalent among females, those with acute admissions, older age, and patients with dementia, frailty, or functional dependency.127
- A systematic review and meta-analysis of 196 studies involving 583,972 older adults across 24 European countries revealed that 28% of hospitalised older adults are at high risk of protein-energy malnutrition, with prevalence highest in those over 80, women, and individuals with multiple comorbidities. Rates varied significantly by country, from 15.2% in Spain to 37.7% in Switzerland, and by screening tool, ranging from 14.9% with MNA-SF to 40.6% with NRS-2002, highlighting the need for standardised malnutrition screening across Europe to improve care for at-risk populations.128
- Supporting these findings, a meta-analysis of 47 studies (18,039 patients) found high malnutrition risk (66%) among hospitalised older adults globally, with strong associations between malnutrition, frailty (OR: 5.77), and sarcopenia (OR: 4.06).129 Similarly, a study from China found 8.8% of hospitalised elderly patients malnourished and 30.7% at risk, with risk factors including older age, chronic conditions, and functional dependency.130 These data from outside of Europe reinforce the need for comprehensive, region-specific strategies to address malnutrition among hospitalised elderly populations in Europe and beyond.
Summary of large-scale studies of the prevalence of malnutrition and risk of
malnutrition in older people in hospital (n > 1000; using a validated screening tool)
| Country / Region | Author (year) | Patients (n) | Timing of nutritional assessment / screening (data collection) | Prevalence % | Method of assessment / screening |
|---|---|---|---|---|---|
| Europe† | Kaiser et al. (2010) 124 | 1384 | Not available | 86 (47.3 at risk, 38.7 malnourished) | MNA |
| Belgium | Vanderwee et al. (2011) 70 | 2094 | Cross-sectional (between 16th May and 15th June 2007) | 31.9 | MNA-SF |
| Switzerland | Imoberdorf et al. (2010) 103 | See Table A1.2, Appendix I | On day of admission | 22 (65-84 years) 28 (>85 years) |
NRS-2002 |
| UK | Russell & Elia (2012) 72 | See Table A1.2, Appendix I | Within 72 hours of admission (spring 2011) | 28 | ‘MUST’ |
| UK | Russell & Elia (2012) 93 | See Table A1.2, Appendix I | Within 72 hours of admission (winter 2010) | 39 | ‘MUST’ |
| UK | Russell & Elia (2011) 105 | See Table A1.2, Appendix I | Within 72 hours of admission (summer 2008) | 32 | ‘MUST’ |
| UK | Russell & Elia (2009) 104 | See Table A1.2, Appendix I | Within 72 hours of admission (autumn 2007) | 30 | ‘MUST’ |
†Retrospective pooled analysis of data from studies in older people in hospitals in Belgium, Switzerland, Germany, Italy and Sweden
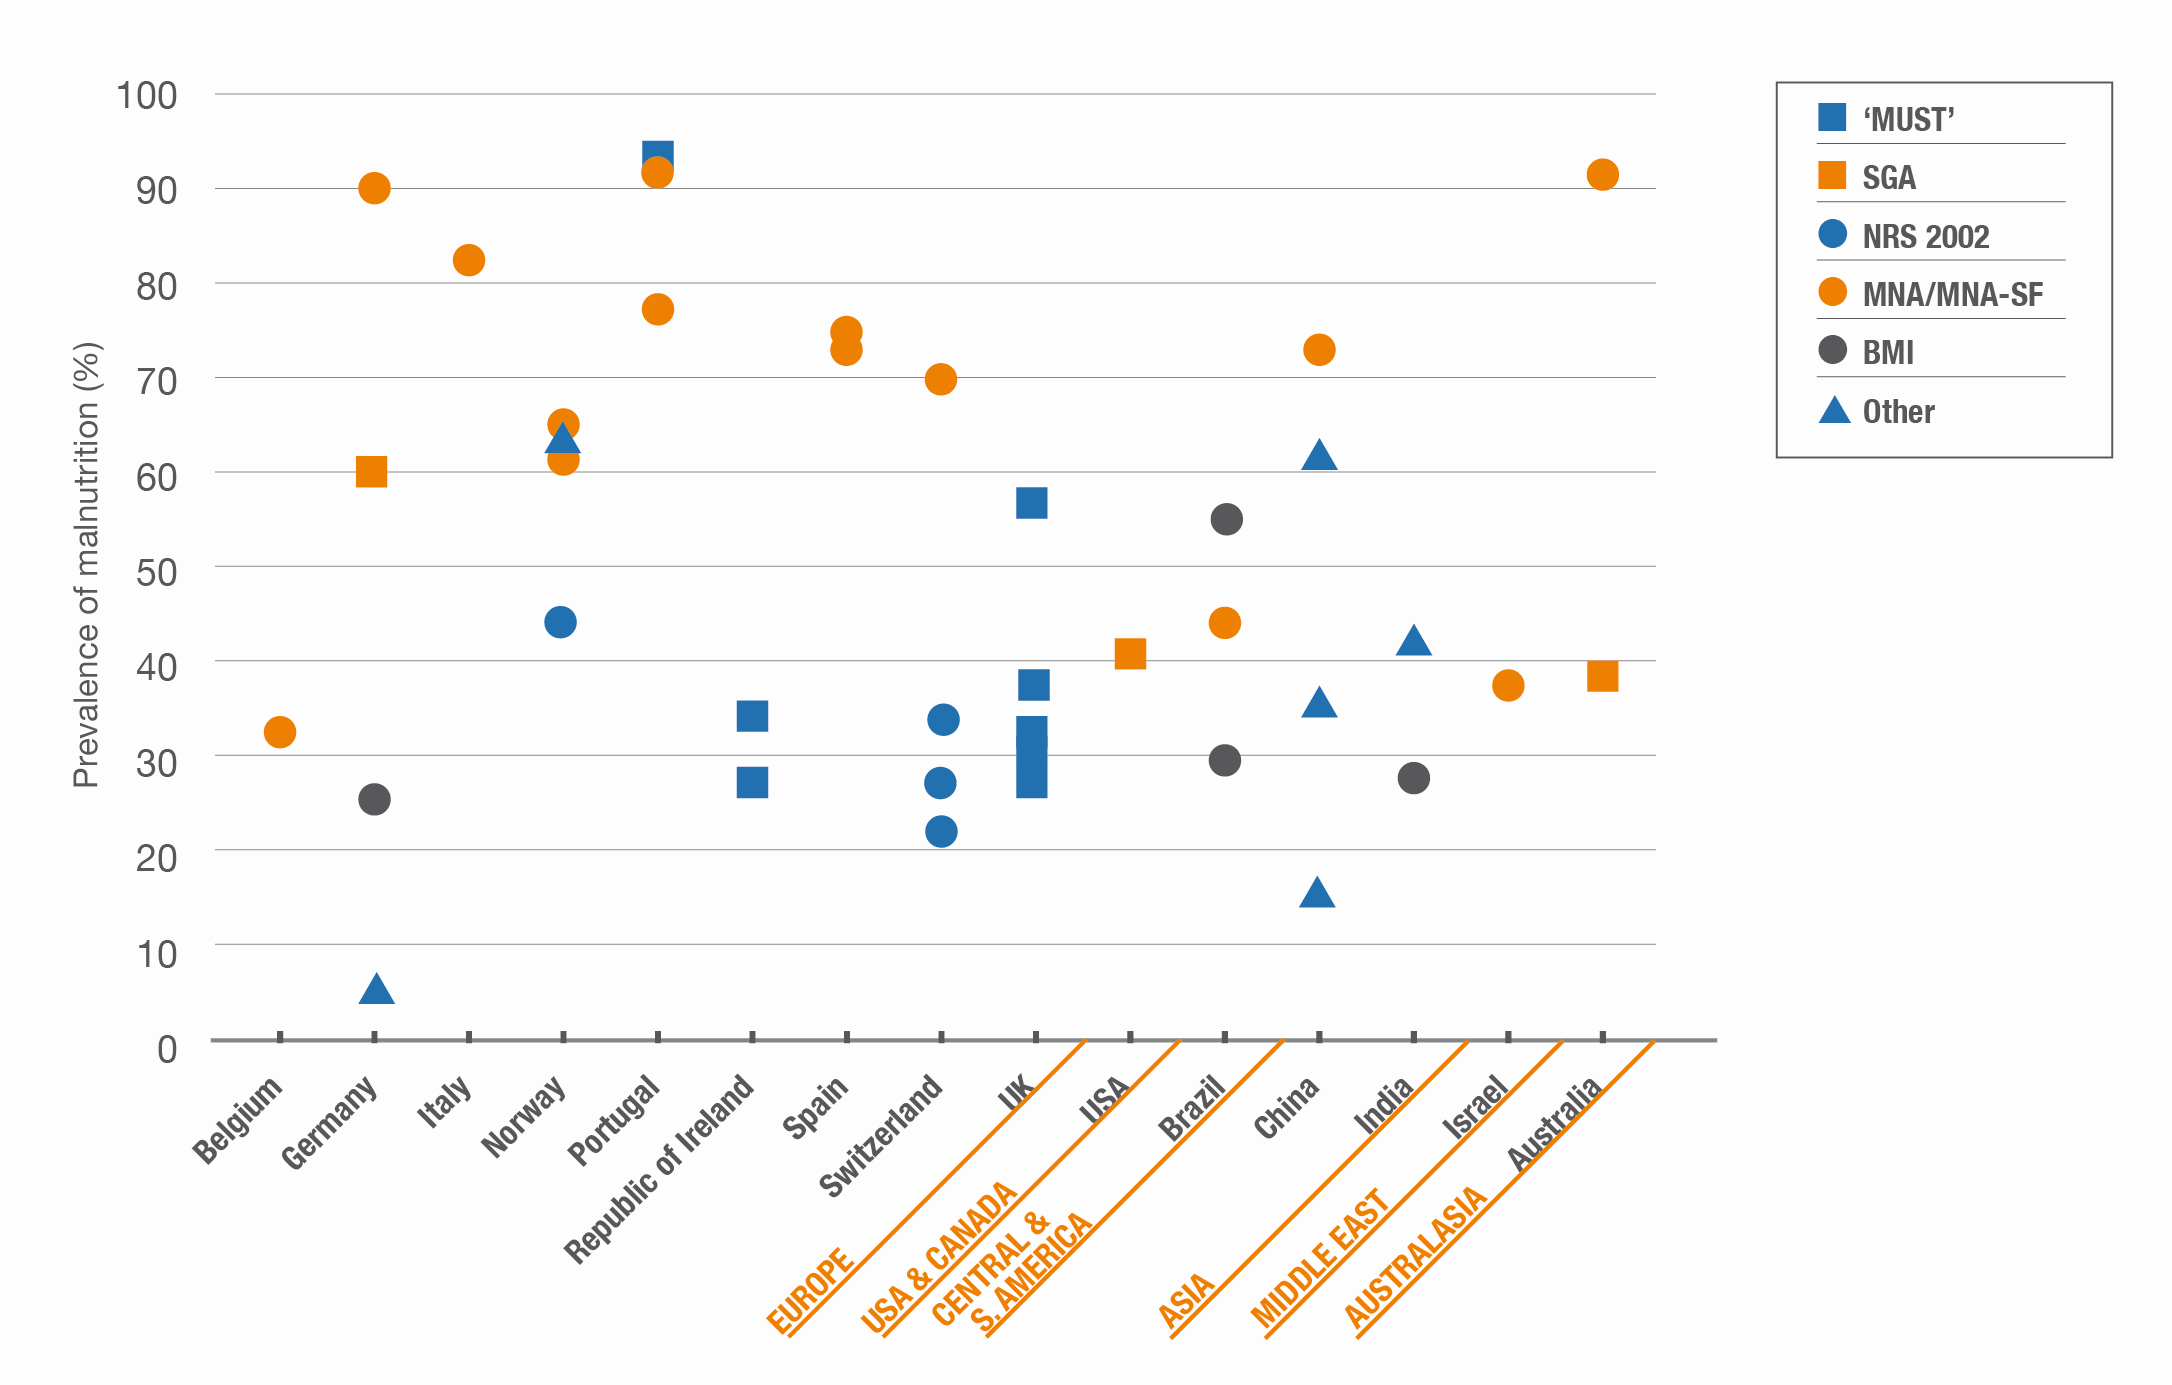
Prevalence of malnutrition risk in older people in hospital using different screening methods by country and world region (see Appendix I, Table A1.2 for full details)
 Malnutrition in children in developed countries
- Whilst childhood malnutrition is internationally recognised as a major public health problem in developing countries, especially those afflicted by poverty, war and famine, it is often assumed to be absent in affluent developed countries. Worldwide, under-nutrition is an underlying cause of nearly half of all deaths in children younger than 5 years131-133 Underweight, low weight for age, does exist in developed countries and it is projected to decrease from 1.6% in 1990 to 0.9% in 2015, a change of -41%.134 of global concerns, wasting, low weight for height, does exist in developed countries too, and it is projected to decrease from 2.3% in 1990 to 1.1% in 2015, and further to 0.7% in 2025, reflecting a total change of -70% over 35 years.135 However, although these figures appear low in comparison to developing countries, malnutrition and underweight is a significant problem in developed countries, particularly in children with underlying disease-related malnutrition, as illustrated by the high prevalence of malnutrition on admission to hospital.
Globally in 2022, 149 million children under the age of 5 years were stunted, 45 million were wasted, and 37 million were overweight.132-136
Malnutrition and risk of malnutrition is common in children in hospital
- Malnutrition and risk of malnutrition has been reported in 2–85% of children in hospital (see Figure 1.10 and Table A1.8, Appendix I). The prevalence reported in the literature varies due to the different methods used for either screening for malnutrition risk or assessment of nutritional status, the criteria used to define malnutrition, how the results have been reported (whether they include mild, moderate and severe malnutrition or acute and/or chronic malnutrition), the type of population studied, and the disease spectrum of the subjects included or excluded from individual studies. Significant disparities in malnutrition diagnoses emerged based on hospital type, race/ethnicity, and patient age, underscoring a continued need for enhanced professional education, especially in non-teaching hospitals, to support standardised, accurate malnutrition diagnosis in paediatric settings.133
- Studies using nutritional risk screening tools specifically designed for paediatric populations like the Paediatric Yorkhill Malnutrition Score (PYMS) , compared to studies that use anthropometric measures alone, such as WFH, weight-for-age (WFA), % ideal body weight (IBW), BMI, TSFT and MUAC (2.5–52%),87,89,(see Figure 1.10 and Table A1.8, Appendix I).
- In Canada, recent studies indicate that approximately one in three hospitalised children is either malnourished or at risk of malnutrition149, highlighting the global scale of hospital malnutrition among the paediatric population.
Data from large-scale national or regional surveys describing the prevalence of malnutrition risk in children on admission to hospital is emerging
- A large cross-sectional study (The Children’s Nutrition Survey) undertaken in the UK and Ireland found a prevalence of malnutrition in children (mean age 5.7 years) of 11% (in terms of WFA ≤ 2 SD; timing of assessment not specified) (n = 1003). Thirty-one hospitals participated, 20 of which had nutrition support teams.88
- A prospective multi-centre cohort study investigating the prevalence of malnutrition risk in children on admission to hospital and the impact on outcomes is currently underway in 14 centres across 12 different European countries and it is being funded by ESPEN. The study also aims to arrive at an agreement on the preferred screening tool for identifying nutritional risk in children.
- A prospective multi-centre cohort study involving 2,567 hospitalised children from 14 hospitals in 12 countries in Europe from 2010 to 2011, found that 7% of patients had a BMI below -2 SD, indicating underweight, with higher prevalence in younger children (10.8% in infants). Overall, 13.4% of patients showed signs of underweight and/or stunting. The study used three nutritional screening tools (PYMS, STAMP, STRONGKIDS), but agreement among these tools was low, highlighting the challenge of consistent malnutrition assessment. Malnourished children experienced longer hospital stays and more complications, underscoring the need for effective nutritional screening and interventions in paediatric settings.133
- In contrast, a large U.S. retrospective study of 13.2 million paediatric hospitalisations (2012–2019) revealed an increase in coded diagnoses of malnutrition (CDM) from 3.9% to 6.4%, driven by changes in diagnostic patterns. While “failure to thrive” diagnoses declined from 40.6% to 23.3%, protein-calorie malnutrition and other malnutrition subtypes became more frequently reported. This reflects a growing recognition of malnutrition’s diverse manifestations in U.S. paediatric care, alongside an increasing focus on accurate identification through ICD-9/10 coding.150
- These findings underscore regional differences, with Europe facing challenges in consistent screening tool application and the U.S. showing evolving diagnostic practices. Both highlight the critical need for improved malnutrition assessment and intervention strategies tailored to local healthcare systems.
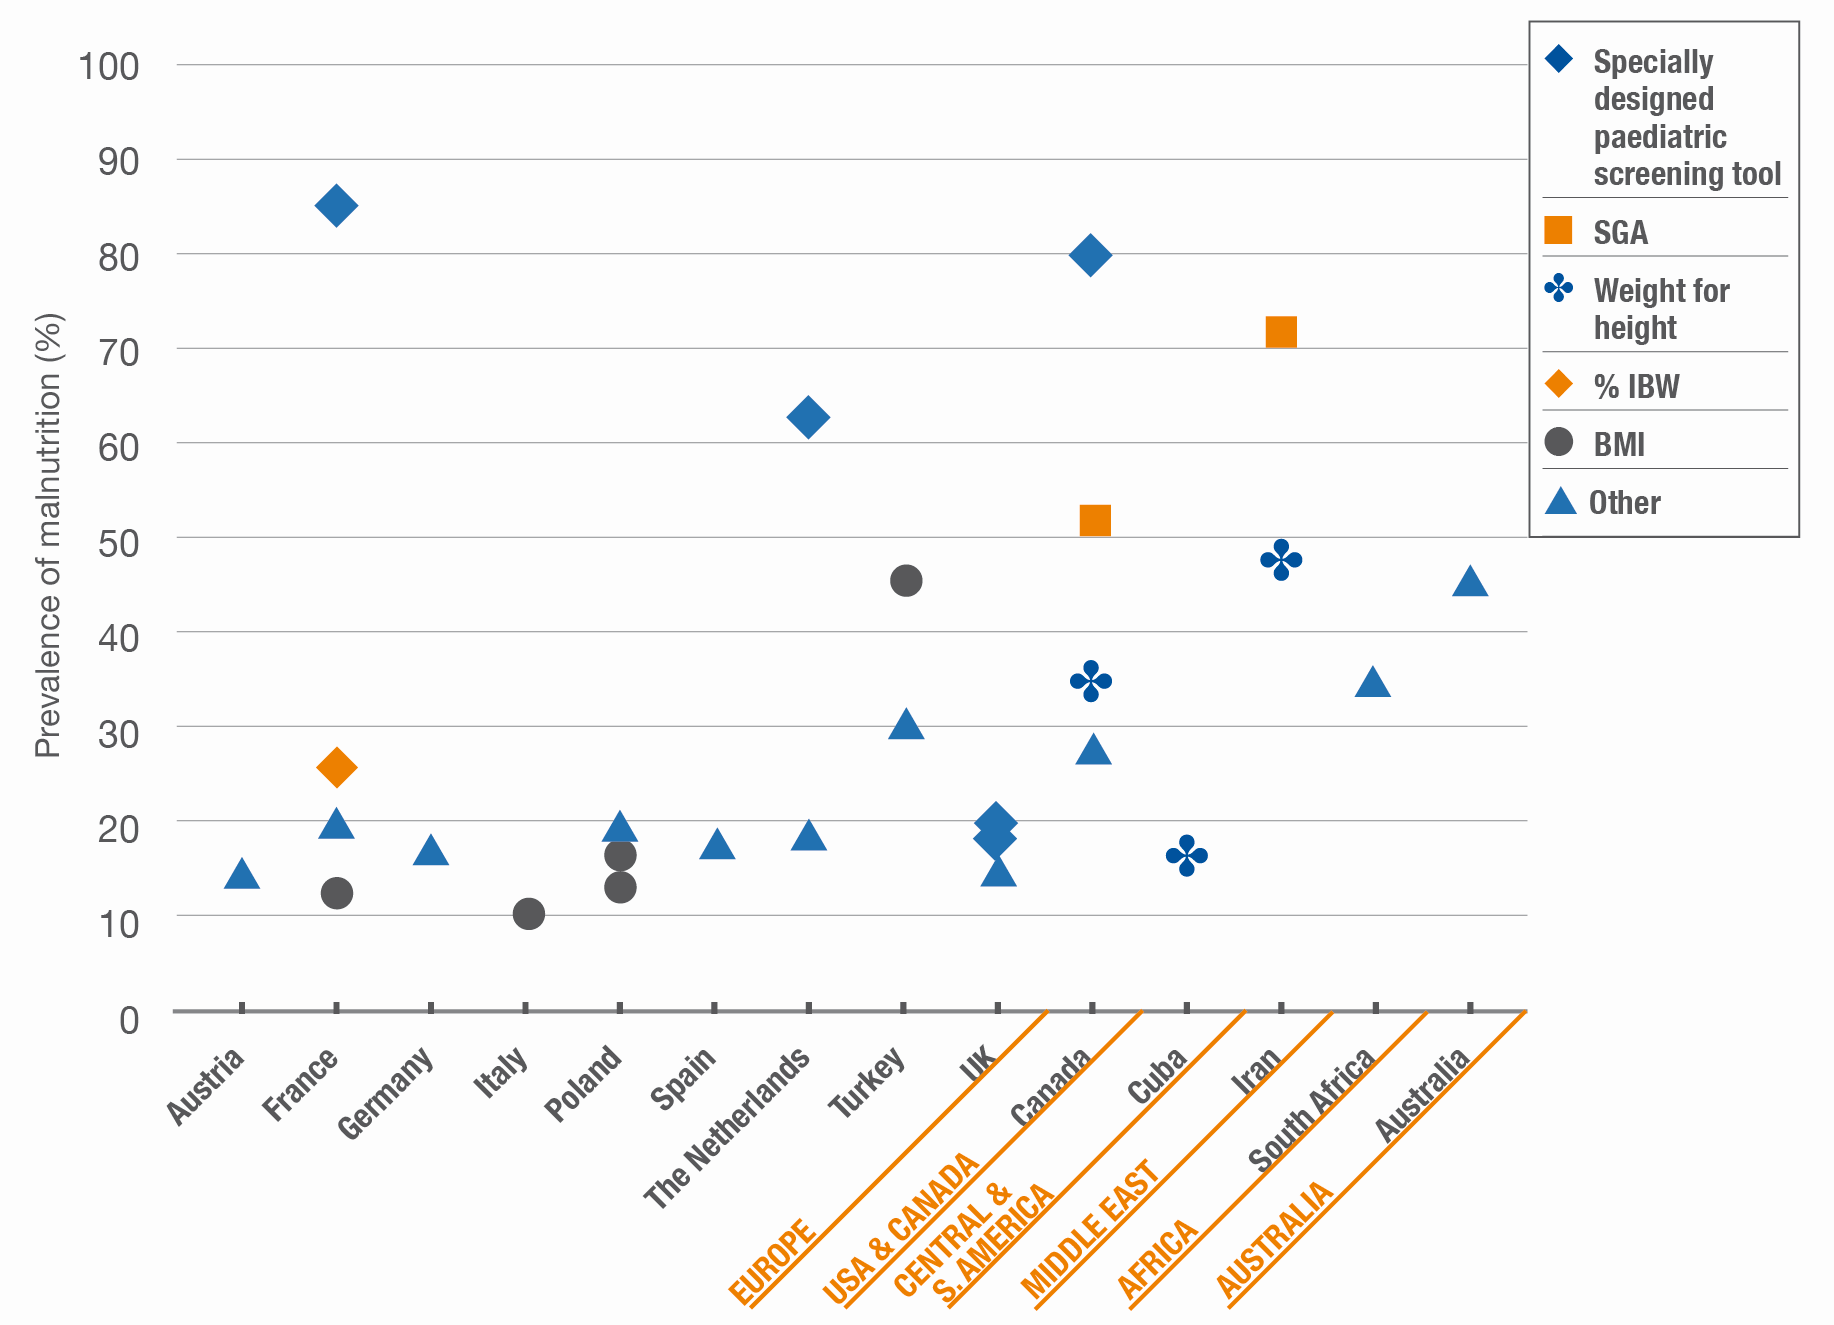
Prevalence of malnutrition and risk of malnutrition in children in hospitals using different screening and/or assessment methods by country and region (see Appendix I, Table A1.8 for full details)
Malnutrition and risk of malnutrition are common across a variety of hospital wards
Malnutrition and risk of malnutrition are common across a variety of hospital ward types, with a particularly high prevalence in care of the elderly, oncology, neurology,151,152 respiratory, endocrine and gastroenterology wards/specialities (see Figure 1.13).49,72,73,102,114
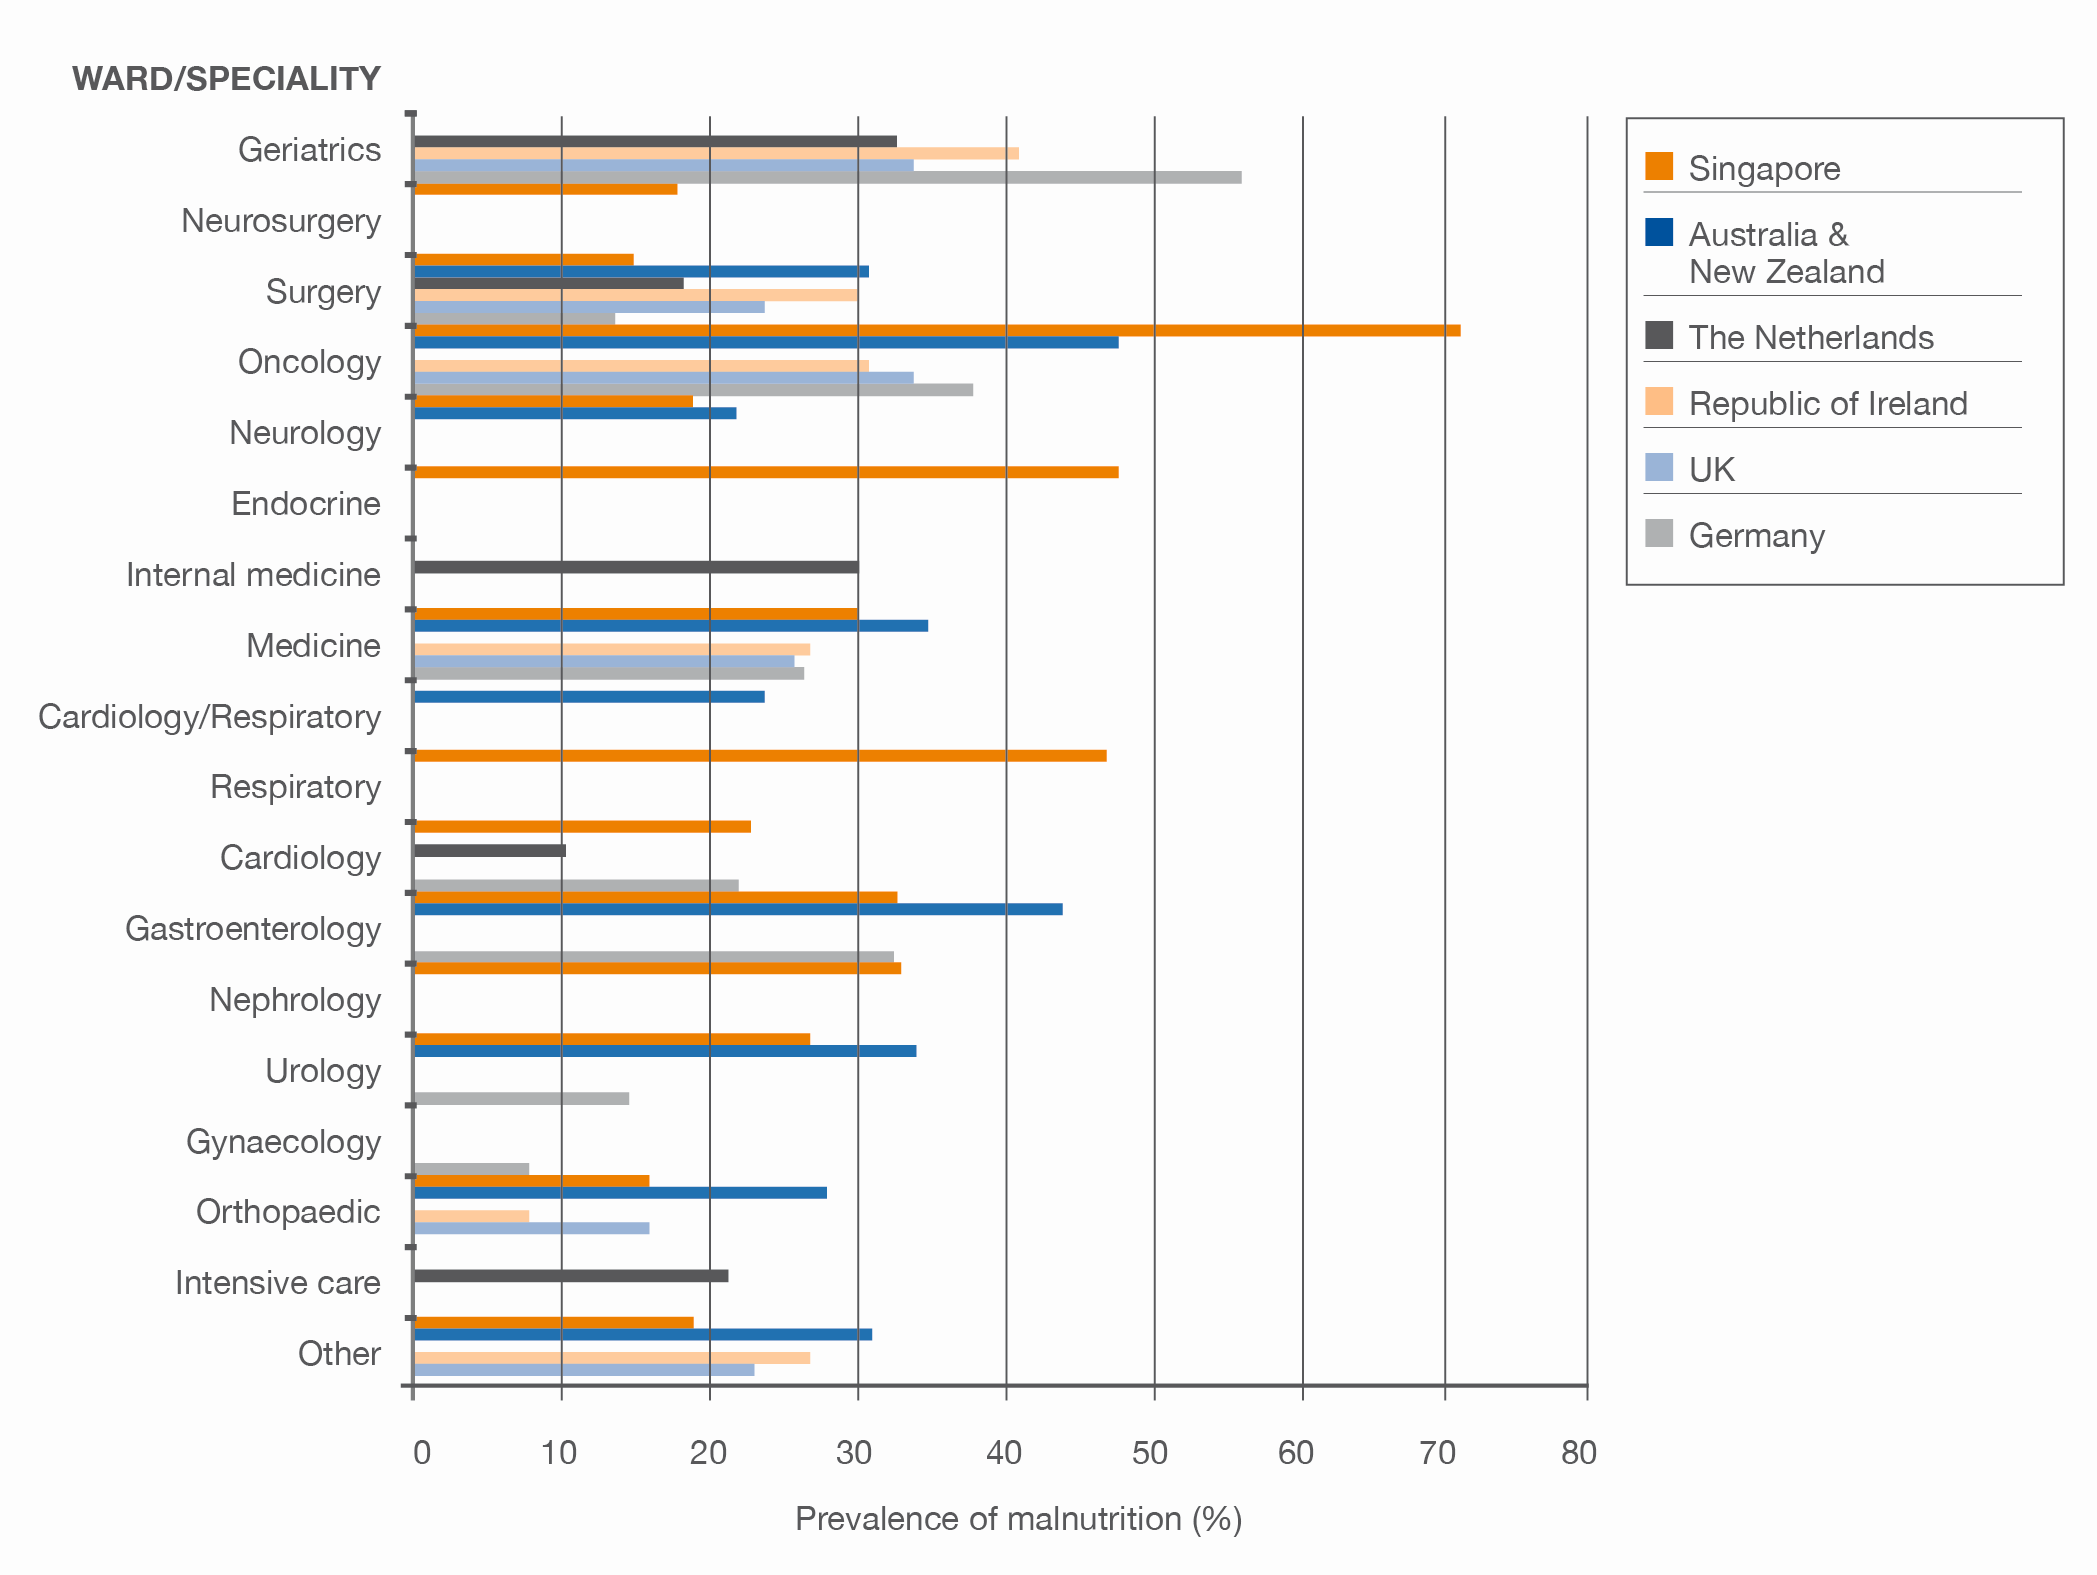
Prevalence of malnutrition and risk of malnutrition according to hospital ward/primary admitting speciality
(Singapore n = 818 [SGA B+C], Australia & New Zealand n = 3080 [SGA B+C & BMI], the Netherlands n = 8028 [defined by BMI, undesired weight loss, nutritional intake*], UK n = 7408 [‘MUST’ medium + high risk], Republic of Ireland n = 1090 [‘MUST’ medium + high risk], Germany n = 1886 [SGA B+C])31,50,51,68,74 (*see details in Table A1.1)
Malnutrition in children is more common in specialist wards and hospitals than in general units, and the most vulnerable children are those with multiple medical problems.153
- In hospitals in the Netherlands, a significantly higher rate of chronic malnutrition (HFA < – 2 SD) was found in children admitted to academic hospitals (14%) compared to general hospitals (6%), p = 0.013. This may reflect the nature of the cases seen at academic hospitals, where possibly more complex cases are managed.141 Hulst et al. (2010) found that the distribution of risk categories differed between general and academic hospitals i.e.15% of children in academic hospitals were at high risk vs 5% in general hospitals (p = -0.014 for low vs high risk and p < 0.001 for moderate vs high risk).39
- Gerasimidis et al. (2011) found that a high risk of malnutrition was more prevalent in the specialist wards than the acute receiving wards of a tertiary paediatric hospital (18% in specialist vs 8.3% in acute receiving).48
Malnutrition and risk of malnutrition is prevalent in a wide variety of diseases in adults
- Recent large-scale multi-centre surveys consistently show that malnutrition risk is common across many diagnostic groups in hospitals, with a particularly high prevalence in patients with GI, respiratory and haematological disease and cancer (see Figure 1.12).72,102
- Other studies document the prevalence of malnutrition in chronic conditions including heart disease and metabolic syndrome as well as chronic kidney disease.154-156
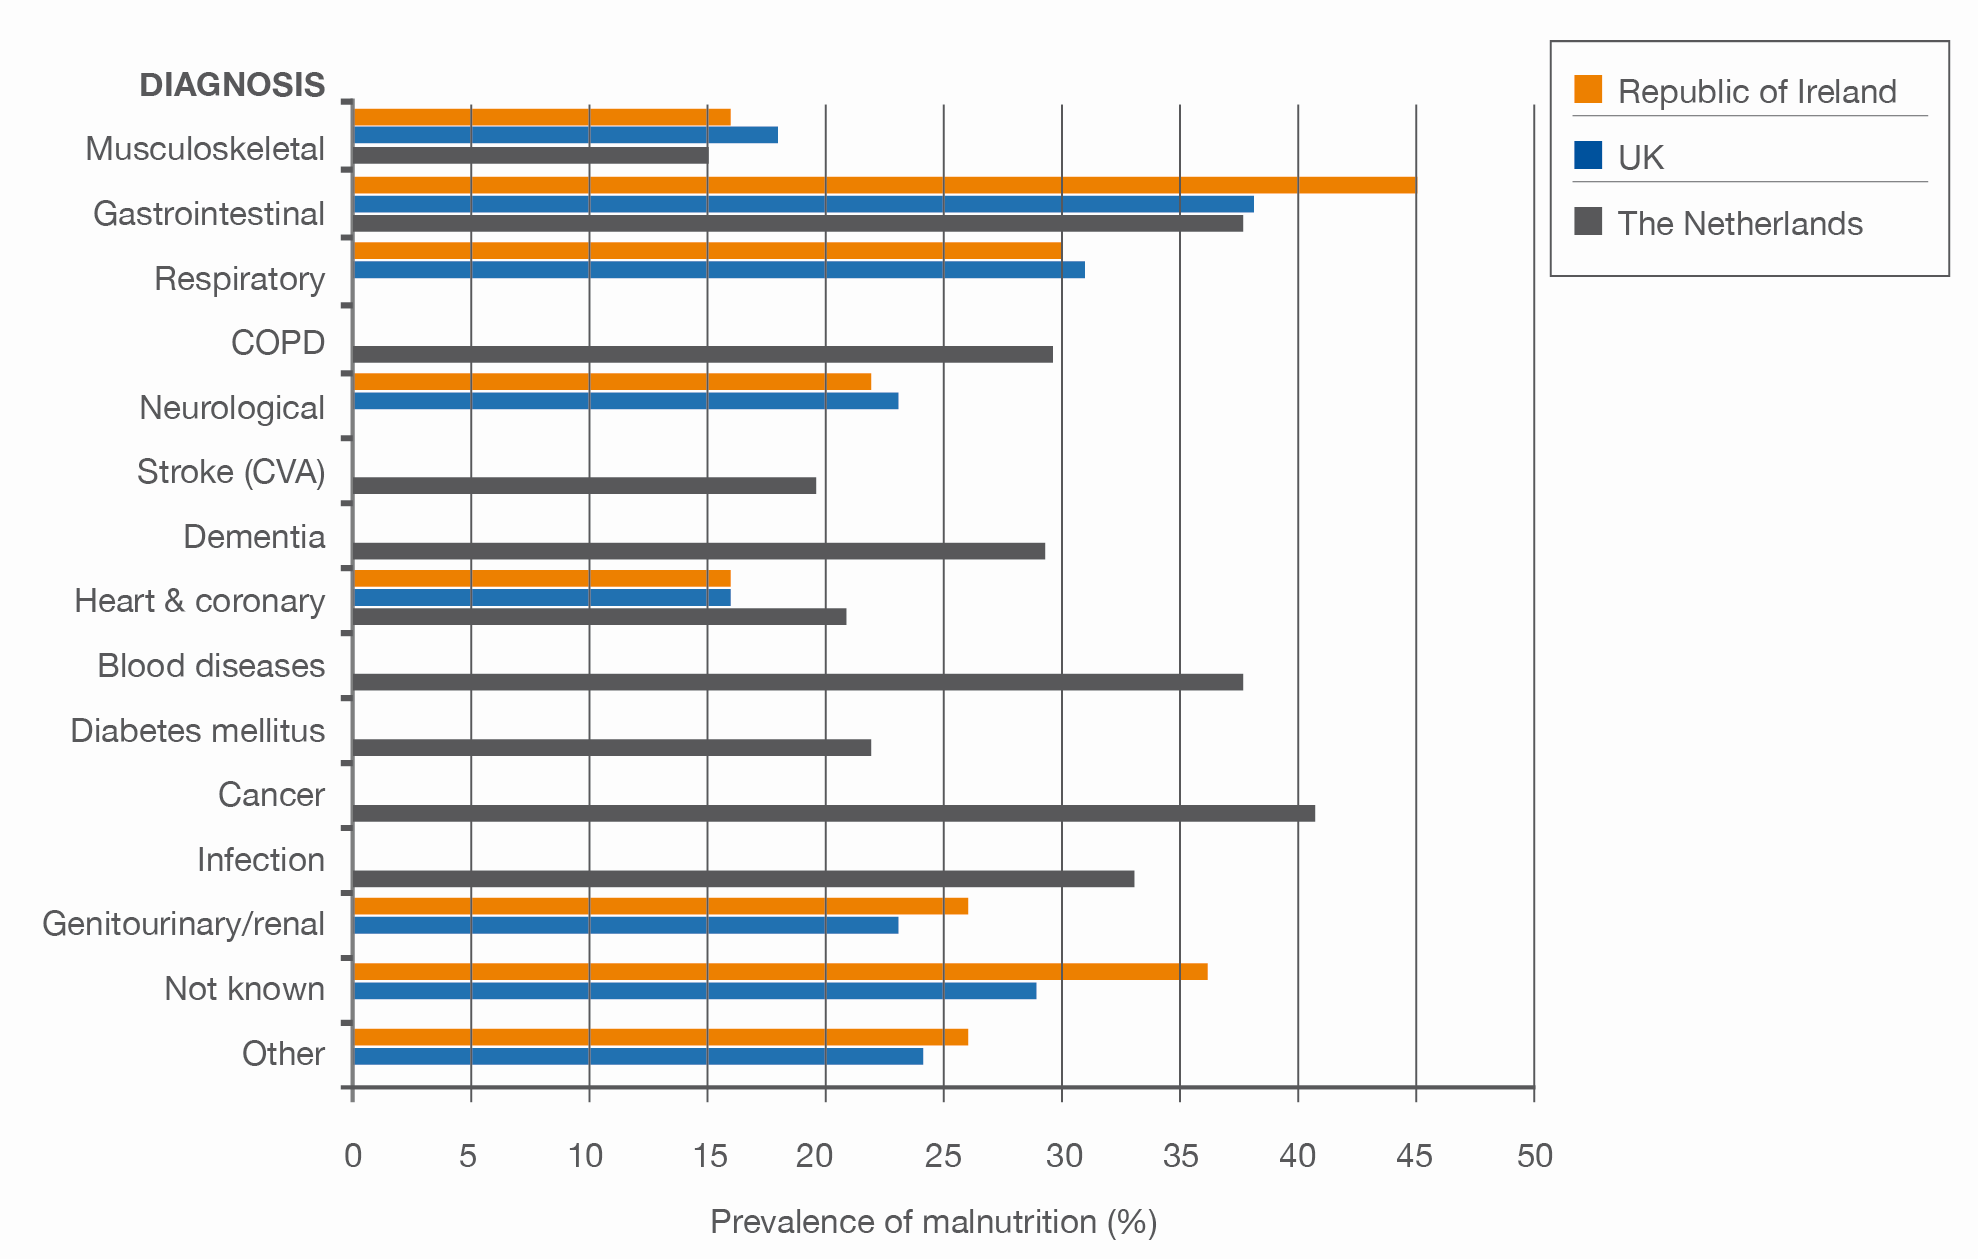
Prevalence of malnutrition risk in hospital by diagnosis
(Republic of Ireland n = 1102 [‘MUST’ medium + high risk], UK n = 7521 [‘MUST’ medium + high risk], the Netherlands n = 8028 [defined by BMI, undesired weight loss, nutritional intake*]).50,68
(*see details in Table A1.1)
Malnutrition is prevalent in a wide variety of diseases in children
- In a study of children (n = 475) on admission to a large tertiary care children’s hospital in Germany, the greatest prevalence of malnutrition was found in patients with multiple diagnoses (42.8%), children with learning disabilities (40.0%), children with infectious diseases (34.5%), and children with cystic fibrosis (33.3%) (see Figure 1.14).87 Note that the overall figures include mild, moderate and severe malnutrition.
- A multicentre study conducted in Turkey across 37 hospitals and involving 1513 hospitalised children assessed malnutrition risk using the STRONGkids and Pediatric Yorkhill Malnutrition Score (PYMS) tools, with the following findings:
- 9.5% of children had a BMI standard deviation score below −2 at hospital admission, and 11.2% had a weight-for-length/height score below −2.
- According to STRONGkids, 91% of patients at high malnutrition risk had an underlying chronic disease, compared to 47% at medium risk and 45% at low risk.
- PYMS results showed that 75% of patients at high malnutrition risk had chronic diseases, compared to 55% at medium risk and 44% at low risk. 157
- Similar trends were observed outside Europe. For example, in a prospective cohort study of 816 children and adolescents (883 admissions) aged 1 month to 18 years across four tertiary care hospitals in Thailand between December 2018 and May 2019, the overall prevalence of malnutrition was 44.5%. Acute and chronic malnutrition were observed in 14.3% and 23.6% of patients, respectively. The greatest prevalence of malnutrition was noted in patients with chronic medical conditions, including cerebral palsy, chronic cardiac diseases, and bronchopulmonary dysplasia, as well as those with biliary atresia, intestinal malabsorption, and chronic kidney disease.158
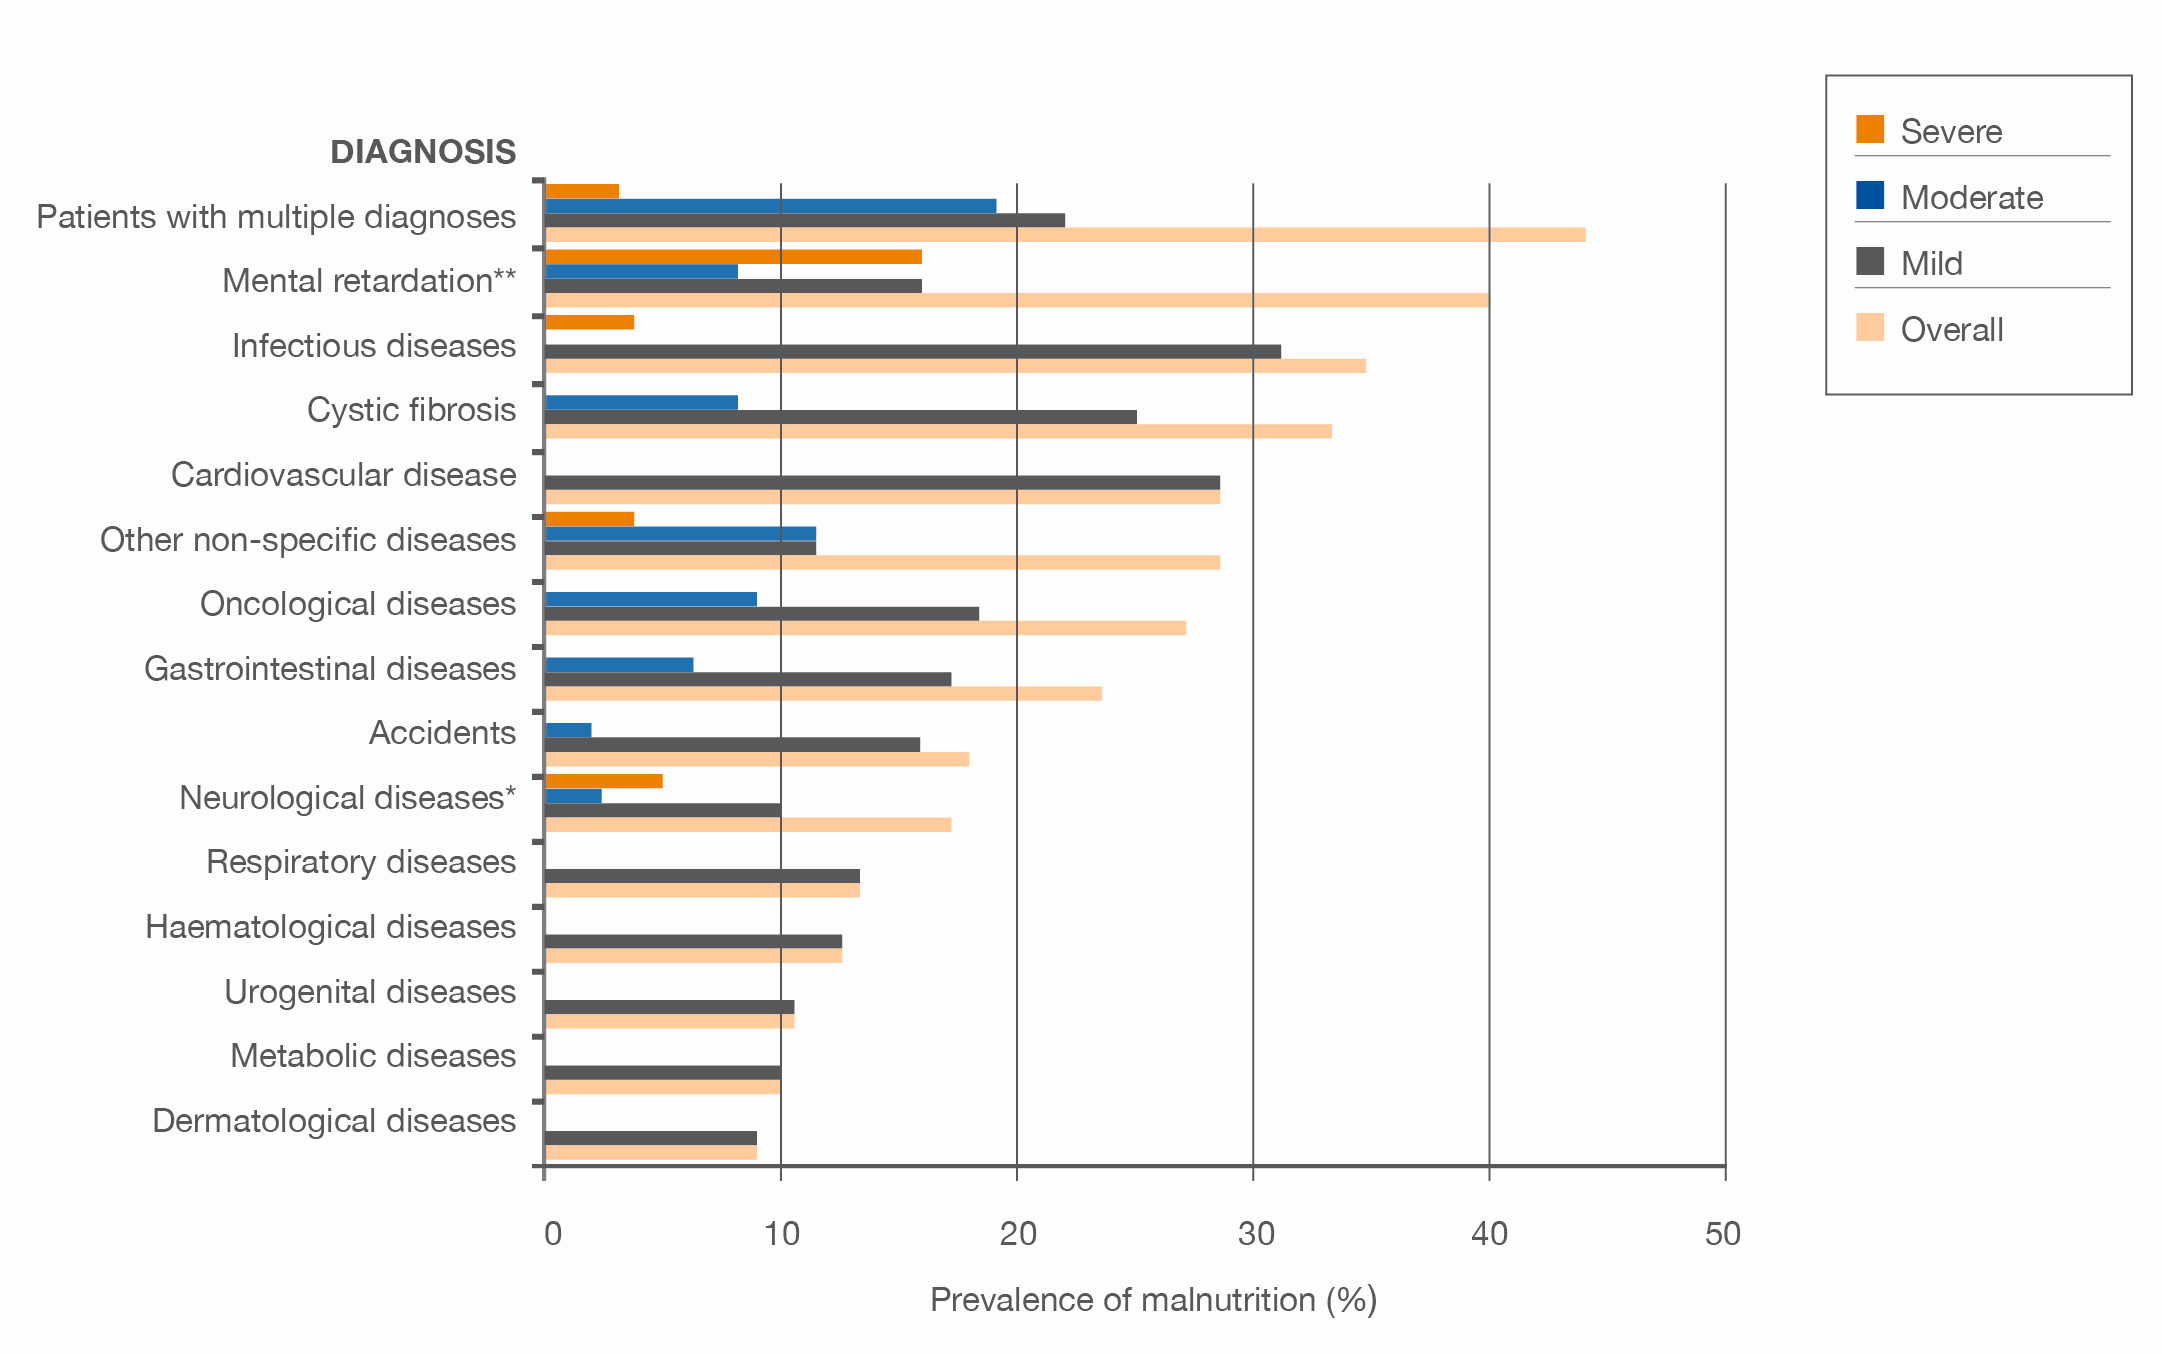
Prevalence of malnutrition in children on admission to hospital in Germany by diagnosis and degree of malnutrition
(*Includes mental retardation, **subgroup of patients with neurological diseases)87
- A nationwide prospective observational study of all newly admitted children to hospitals in the Netherlands (n = 424) found that almost 1 in 5 children had acute or chronic malnutrition. The study also showed that children with an underlying disease had a significantly higher overall prevalence of malnutrition and chronic malnutrition compared to children without an underlying disease (28% vs 15% and 18% vs 5% respectively [p = 0.004 and p < 0.001]).141
- The highest prevalence of acute malnutrition was found in children with GI disease (18%), and the highest prevalence of chronic malnutrition was seen in children with neurological disease (31%); the overall prevalence was around 19% (see Figure 1.15).141
- Using multiple logistic regression analysis that allowed for age, underlying disease, ethnicity and surgery, Joosten et al. (2010) showed that a significant relationship existed between the presence of malnutrition on admission and underlying disease (odds ratio [OR] 2.2, confidence interval [CI] 1.3–3.9; p = 0.005). For chronic malnutrition, both underlying disease and non-white ethnicity were significantly related to a higher prevalence of malnutrition (OR 3.7, CI 1.7–7.8; p = 0.001 and OR 2.8, CI 1.2–6.6; p = 0.016 respectively), but this was not the case for acute malnutriton.141
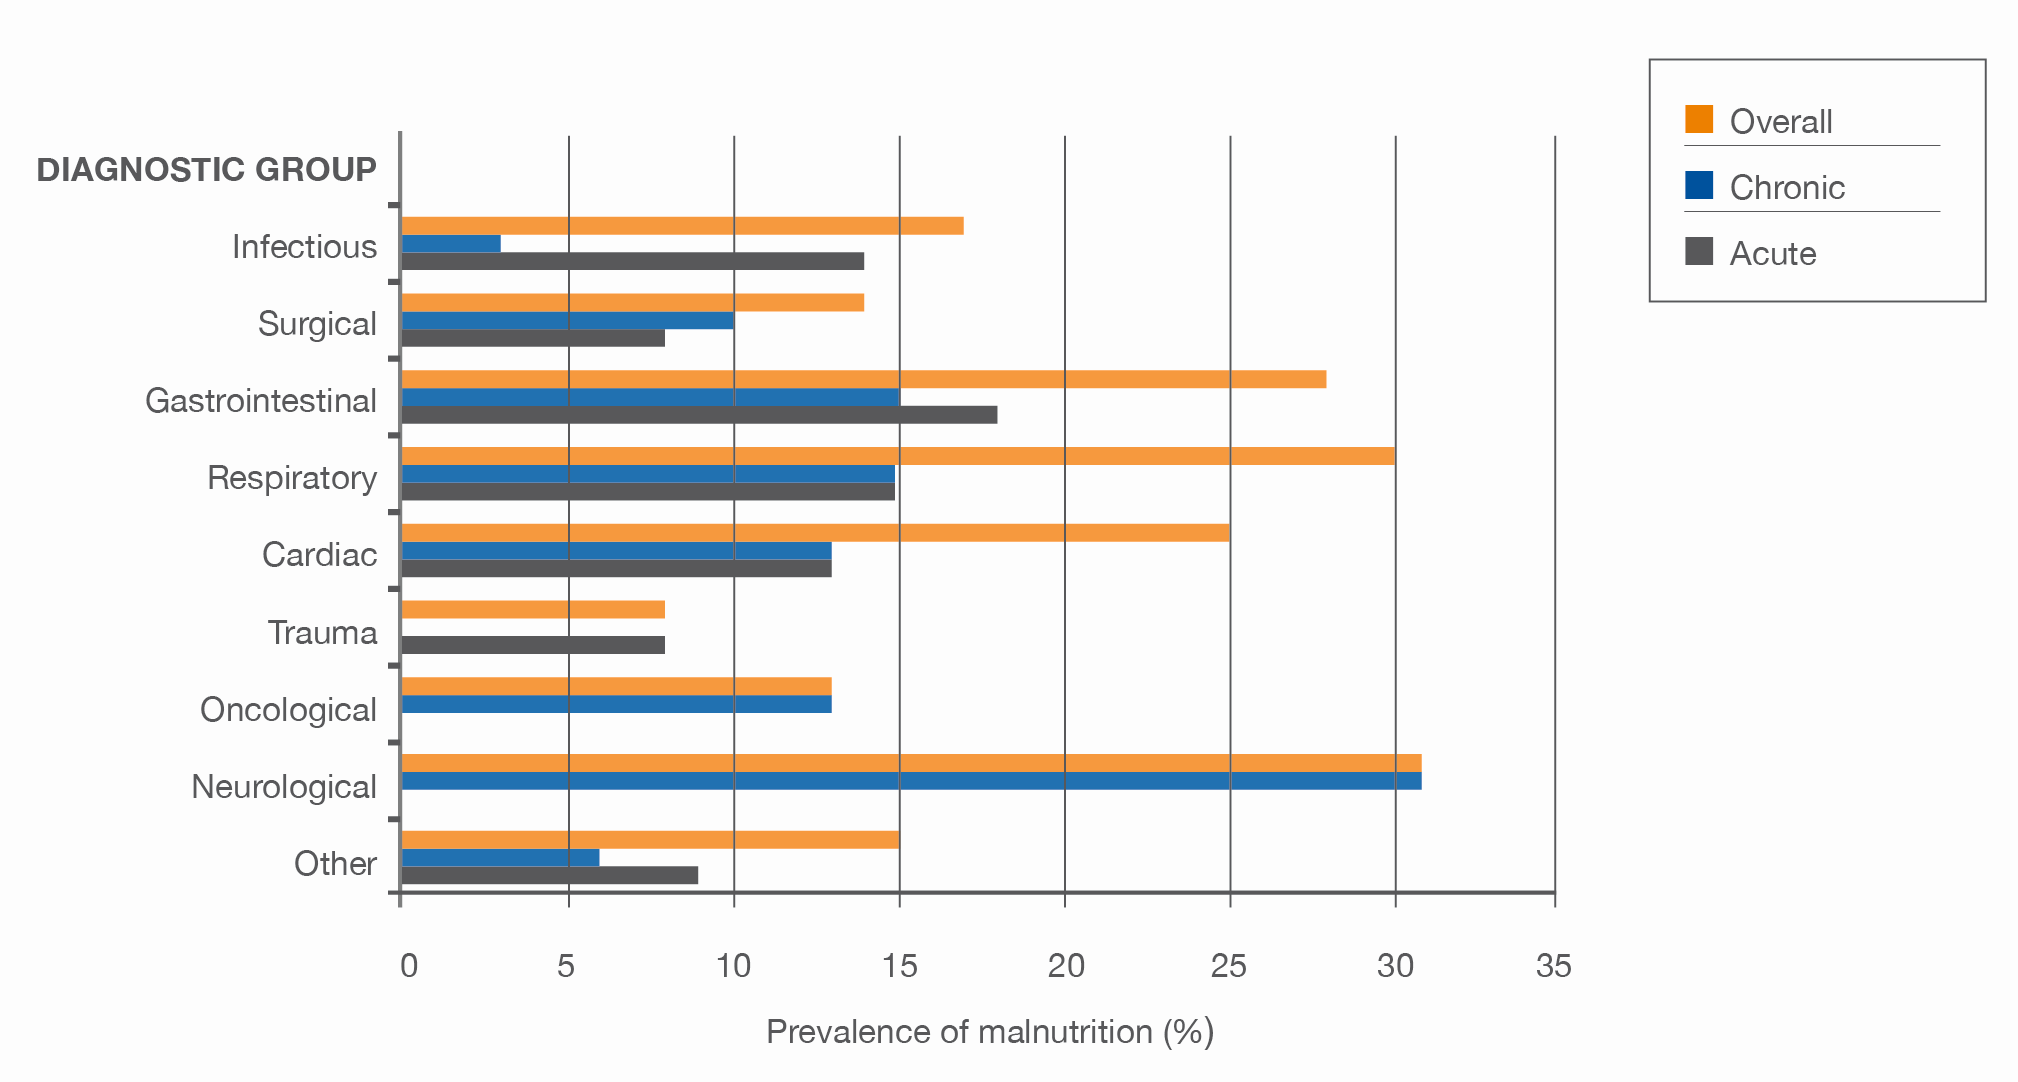
Prevalence rates of malnutrition in children on admission to hospital in the Netherlands by diagnostic group and type of malnutrition141
Deterioration in nutritional status during hospital stay can occur in both malnourished and well-nourished patients
- In a review by Stratton et al. (2003), deterioration in nutritional status during hospital stay was identified in a variety of patient groups e.g. general hospital/mixed diagnoses, paediatrics, stroke and surgical patients, with over 80% of patients in some studies losing weight during hospitalisation.53
- In a systematic review conducted between April and June 2020, hospital-acquired malnutrition worldwide was found to affect up to 65% of inpatients, with nutritional deterioration reported in both well-nourished and nutritionally compromised patients.159
- In a study conducted across six geriatric hospital wards in Germany, participating in nutritionDay 2017–2019, malnutrition was prevalent among patients aged ≥65 years (n = 156). Using MUST, 16.9% of patients were identified as being at medium risk of malnutrition, 33.8% at high risk, and 28.1% were classified as malnourished based on ESPEN criteria. Inadequate eating behaviour was reported in 62.8% of patients during hospital stays.160
- Table 1.7 shows the change in malnutrition risk (assessed using MNA) during hospital stay for older people admitted to medical and surgical wards in a non-teaching hospital in Portugal. A higher proportion of patients were at risk of malnutrition on discharge than on admission.123
Prevalence of malnutrition and risk of malnutrition in older people on hospital admission
and discharge (adapted from Cansado et al. 2009)83
| Surgical patients (n = 341) | Medical patients (n = 190) | |||||
|---|---|---|---|---|---|---|
| MNA Category | Admission (%) Surgical Patients (n = 341) | Discharge (%) Surgical Patients (n = 341) | p* | Admission (%) Medical Patients (n = 190) | Discharge (%) Medical Patients (n = 190) | p** |
| Normal | 21.9 | 22.8 | NS*** | 8.4 | 4.2 | 0.05 |
| Risk of malnutrition | 51.3 | 43.4 | 0.05 | 48.9 | 44.7 | 0.07*** |
| Malnourished | 26.6 | 33.7 | 0.003 | 42.6 | 51.0 | 0.002 |
p* indicates statistical differences for surgical patients on admission vs discharge
p** indicates statistical differences for medical patients on admission vs discharge
***NS: Not Significant
Weight loss can occur in children during hospital stay even when well-nourished on admission
- A study in Sao Paolo, Brazil of 203 children (average age 21.6±15.4 months; majority aged less than 24 months, n = 126, 62.2%) whose nutritional status was assessed within 48 hours of admission to hospital and again a maximum of 24 hours before discharge found that:50
- 51.6% of children lost weight during their hospital stay;
- malnourished children on admission remained malnourished on discharge;
- 9.2% of well-nourished children on admission developed mild malnutrition during their hospital stay.
- Similarly, a multicentre study conducted among 623 hospitalised children (median age 4.3 years) in tertiary-care hospitals in Thailand between December 2018 and May 2019 found the following:
- 24% of patients experienced nutritional deterioration (defined as a reduction in BMI ≥ 0.25 Z-score) during their hospital stay.
- Patients with nutritional deterioration had higher rates of nosocomial infection compared to those without hospital-acquired malnutrition (24% vs. 11%, p < 0.001).
- Risk factors for nutritional deterioration included moderate to severe medical conditions (AOR 1.90), pneumonia (AOR 1.85), seizures (AOR 2.82), and surgery (AOR 2.98). 161
- In a prospective study in France, Sermet-Gaudelus et al. (2000) found that 65% of children lost weight during their hospital stay and that weight loss was > 2% of admission weight in 45% of these children.42
- In a national screening survey in The Netherlands, 65% of children in hospital neither gained nor lost weight, but 3% of children experienced weight loss of more than 5% during their hospital stay.141