
4.1.3 Guideline implementation: Benefits for patients and healthcare systems
Published guidelines demonstrate that ONS are recognised as a key component of care across a wide variety of patient groups. The implementation of guidelines that include the use of ONS in practice have been shown to positively influence clinical practice and patient outcome, for example, in the prevention and management of pressure ulcers, in surgical patients and in patients with hip fracture as documented in the examples below.

 Screening and use of ONS is more frequent in patients with pressure ulcers (hospital and community)
- A cross-sectional survey of 363 institutions and home-care settings in the Netherlands, Germany, and the UK (hospitals 46.9%, nursing homes 25.8% and home care 21.6%) showed that 66.1% of organisations had implemented the European Pressure Ulcer Advisory Panel Guidelines for Pressure Ulcer Prevention and Treatment:76
- nutritional screening in pressure ulcer care was conducted significantly more frequently in organisations where the nutritional guideline was used compared with institutions and organisations not using the guidelines (18.3% ‘never’ performed screening vs 3.0%; p = 0.001);76
- ONS were used more frequently in organisations using the guidelines, whereas tube feeding was used equally in the 2 groups. PN was given less frequently in the group using the guidelines.76
- Nutritional screening in pressure ulcer care is significantly more frequent in settings following structured guidelines, with improvements also noted in ONS use and patient outcomes such as healing time and complication rates. 77
- Wound-specific ONS have been shown to reduce pressure ulcer healing time by up to 7.9 weeks and result in considerable healthcare savings when implemented in guideline-driven care settings. 77
- Staff time savings of 1,040 hours per nursing home per year and reductions in dressing frequency and medical procedures further support the use of guideline-aligned ONS strategies for pressure ulcer management. 77
- In polymorbid patients with pressure ulcers, the ESPEN guideline recommends the use of specialised ONS enriched with arginine, glutamine, and β-HMB to accelerate wound healing. This was supported by randomised controlled trial findings showing improved tissue viability at two weeks with this nutrient-specific supplementation. 78
Better energy intake and reduced pressure ulcers in patients with hip fracture (hospital)
- A pre- and post-test comparison group study of patients with hip fracture (n = 100, mean age 81 years) showed that the use of nutritional guidelines (including preoperative carbohydrate loading and postoperative ONS) compared with standard hospital food and regular nutrition support according to doctors’ and nurses’ knowledge and goodwill significantly increased energy intake (p <0.001). In addition, 5 days postoperatively, fewer patients in the intervention group developed pressure ulcers (18%) compared with the control group (36%) (p = 0.043).79
Improved clinical outcomes in surgical patients (hospital)
- Clinical benefits were observed in a study of older patients (n = 117, median age 67 years, range 60–85) who received a multidisciplinary protocol of perioperative care established by the ACERTO project (n = 75) (included early instead of delayed postoperative feeding and preoperative nutrition support for malnourished patients) compared with patients who received traditional care (n = 42). The number of hours of preoperative fasting decreased, and patients were fed 1 day earlier after the introduction of the new protocol:80
- surgical site infection was significantly reduced (9/42; 28.1% vs 2/75; 2.6%; OR 9.9, 95% CI 2.0–48.6; p <0.01);
- overall postoperative morbidity diminished (16/42; 38.1% vs 16/75; 21.3%; OR 2.2, 95% CI 0.98–5.2; p = 0.05);
- both total length of stay (10 [2–44] vs 4 [2–140] days) and postoperative stay (6 [1–43] vs 2 [1–99] days, p <0.01) were reduced.
- Similarly, a 2021 randomised clinical trial in surgical oncology patients in China found that post-discharge ONS significantly reduced the prevalence of sarcopenia (28.6% vs 42.1%, p = 0.040) and improved skeletal muscle index, supporting the role of structured peri-operative nutritional support in improving surgical recovery outcomes. 81
Screening guidelines: benefits of implementation
A key aspect of many of the guidelines listed in Table 4.1 to Table 4.5 is the correct targeting of nutritional support, including the use of ONS, for patients who have been identified as malnourished or at risk of malnutrition. It is clear that appropriate use of nutritional support is a key part of the wider task of identifying patients at nutritional risk and implementing timely and appropriate care plans to address their needs. Nutritional screening has become mandatory in some countries (for example, Scotland, the Netherlands, and Denmark), although this is not yet widespread across Europe. Documentation of nutritional status as part of clinical examination and treatment is included in legislation in Norway. Evidence is emerging that screening may reduce the prevalence of malnutrition (see country example, The Netherlands) and that the use of screening programmes that include intervention and care planning can contribute to improved outcomes, although more work is needed in this area.
Evidence-based clinical guidelines such as NICE CG32 recommend routine malnutrition screening at key healthcare entry points, including hospital admission, outpatient clinics, and care homes, enabling early identification and timely intervention. 3
The ESPEN guideline similarly emphasises routine screening at hospital admission for early detection and management of malnutrition risk in medical inpatients. 82
Validated tools such as NRS-2002 and MNA-SF are recommended for use in hospitalised polymorbid patients, with evidence linking their use to improved clinical outcomes such as reduced complications, shorter hospital stays, and better survival. 78
These findings support the integration of structured screening and individualised care planning, including ONS where appropriate as part of routine clinical care in this high-risk population.
Implementation of screening guidelines in the hospital setting
- In a study investigating the prevalence of under-nutrition in Swiss hospitals, the proportion of patients found to be at risk of under-nutrition remained constant (1 in 5); however, the proportion of nutritional interventions increased from 63% (in year 1) to 72% (in year 2) to 78% (in year 3) (p <0.05 by analysis of variance), providing a promising indication that participating hospitals became more aware over the course of the study.83
- In a study of hospital inpatients undergoing orthopaedic surgery (n = 98), weekly screening by nurses using the NRS-2002 tool was used to help implement a preventative nutrition policy (patients with an NRS score ≥ 3 were referred to the Clinical Nutrition Unit for nutritional assessment and intervention). Data was collected at 3 time points: Group A = baseline, Group B = 6 months after implementation of NRS-2002, Group C = at 3 years:84
- proportion of patients with weight loss > 5% reduced significantly (58% vs 33% vs 29%, p <0.05);
- proportion of patients referred to the Clinical Nutrition Unit significantly increased (16% vs 63% vs 82%, p <0.05);
- hospital length of stay was reduced in Group C (50±47 days) compared with Group A (72±52) (p <0.05).
- This stepwise approach aligns with international GLIM guidelines, which recommend first screening for malnutrition risk using any validated screening tool, followed by a diagnostic assessment based on weight loss, low BMI, reduced muscle mass, reduced intake, or inflammation. 85
- In a group pre- and post-test study in patients aged > 65 years admitted to sub-acute geriatric and rehabilitation wards, the use of nutritional screening and an early intervention programme (referral to a dietitian, nutritional assessment and nutrition care plan) led to significantly increased energy (p = 0.0001) and protein intake (p = 0.01) and improvements in health-related QOL (p <0.05).86
- This is consistent with findings from a 2022 review highlighting that when patients identified at nutritional risk are referred for comprehensive assessment and receive tailored nutrition interventions, improvements are observed in dietary intake, functional outcomes, and overall quality of life.87
- Implementation of nutrition guidelines improved nutrition screening performance (p = 0.012 from 1st to 8th point in prevalence survey) in a Norwegian University hospital but not the fraction of patients treated (p = 0.66).88
- Similarly, a 2019 narrative review found that although screening tools like MNA-SF and MUST can improve malnutrition risk detection, they often fail to improve care delivery unless institutional barriers like time constraints, lack of staff training, or poor referral pathways are addressed. 89
- Implementation of nutrition standards (defined by the Danish Health Quality Programme) improved records for screening (NRS-2002) (56% to 77%; p <0.001), nutrition plans (21% to 56%; p <0.0001) and monitoring (29% to 58%; p <0.0001), with an improvement in energy intake (> 75% of energy requirements) from 52% to 68% (p <0.007) and protein intake (33% vs 52%; p <0.001).90
 Implementation of screening guidelines in the community setting
- A study of the implementation of a written food and meal policy, systematic screening (using the MNA-SF) and nutrition care planning (including energy and protein drinks, small meals and snacks) in nursing home residents (n = 20, time series design, i.e., residents used as their own controls, quarterly measurements from December 2004 to December 2005) showed:91
- a significant increase in the proportion of weight-stable residents over the study (52.6% at baseline vs 87.7% at the end of the study, p <0.01);
- a significant reduction in the proportion of residents losing weight (42% to 13.3%, p <0.01).
- Implementation of screening using ‘MUST’ in line with NICE guidelines in 6 care homes in the UK (n = 208 residents, median age 86 (37–105) years, data collected on the same residents before and after implementation for 3 months) showed:92
- a significant increase in documentation of nutritional information (height 43–100%, weight 75–100%, and proportion screened using ‘MUST’ 57–100% [p <0.001]);
- a 32% increase in the use of nutritional care plans;
- a 31% reduction in hospital admissions (13% vs 9%) (27% reduction in emergency admissions, 11% vs 8%), although this was not significant;
- a significant reduction in length of hospital stay (58%, mean length of stay reduced from 2.67 days ±11.48 to 1.13 days ±4.74, p <0.005) and hospital costs (mean saving €674ⁱ [£599] per resident over 3 months).
A 2019 systematic review from the MaNuEL project highlighted that validated screening tools such as MNA-SF, MUST, and SNAQ-RC are essential in residential and community care for older adults, and that routine screening—especially when paired with follow-up interventions—can help prevent deterioration in nutritional status and reduce adverse outcomes. 93
ⁱCalculated based on an exchange rate of 1 GBP = 1.1245 EUR (Source: Interbank 12/07/2017)
Nutritional screening as part of a programme of nutritional care
A review of the evidence for the impact of improving nutritional care on nutritional and clinical outcomes and cost suggested that screening alone may be insufficient to achieve beneficial effects, with the following implications for practice:94
| • Consensus on screening suggests that adequately validated and reliable screening tools are a useful way of identifying patients at risk of malnutrition. |
| • Nutritional screening together with appropriate intervention may confer benefits on patients in terms of outcome. Nutritional screening alone is unlikely to result in measurable benefits. |
| • Provision of optimal nutritional care encompasses not only screening and assessment, but also food service provision, eating environment, feeding assistance, recognition of individual needs and preferences, monitoring and documentation. |
| • Such improvements are likely to benefit from a multidisciplinary approach, with input from senior managers and clinicians. |
ⁱCalculated based on an exchange rate of 1 GBP = 1.1245 EUR (Source: Interbank 12/07/2017)
Implementation in practice: A national example – Scotland
- Nutritional screening is mandatory in Scottish hospitals. Under the terms of the Scotland Act 1998, the devolved administration in Scotland has the power to pass laws on a range of issues including health.
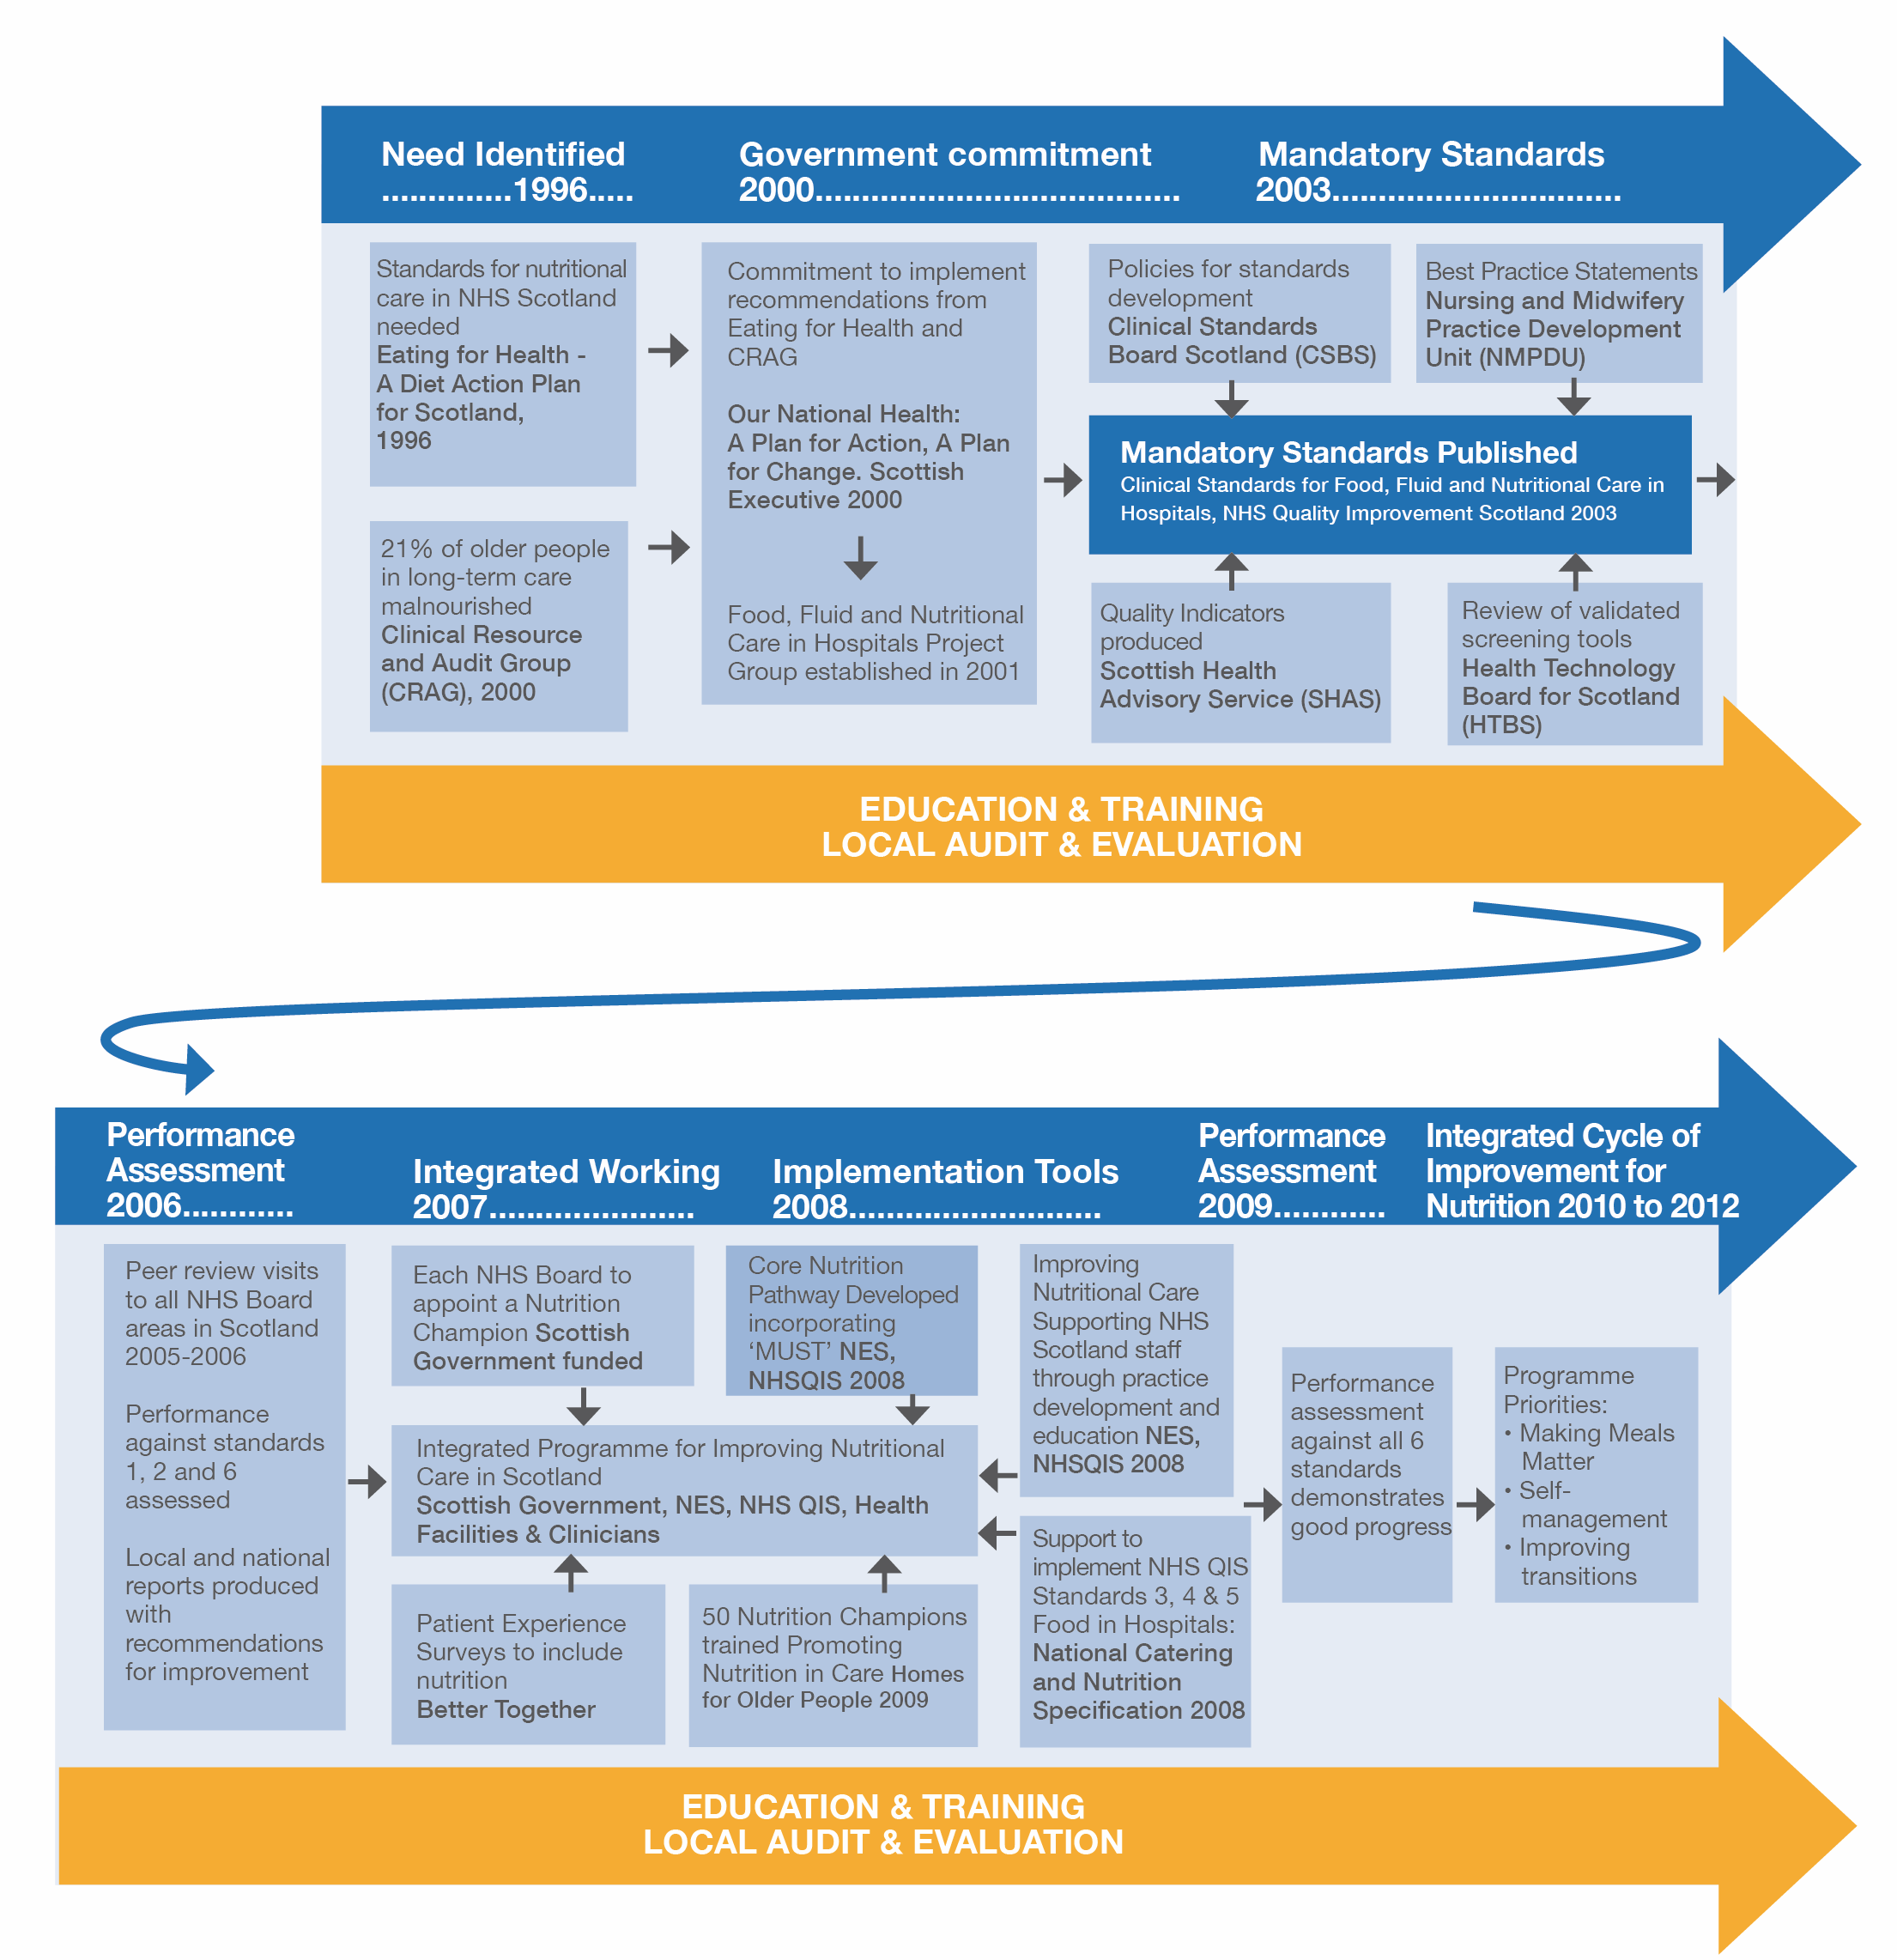
- Figure 4.5 provides an overview of some of the key milestones in the evolution of strategies to improve nutritional care in NHS Scotland.
- The introduction of mandatory government standards for Food, Fluid and Nutritional Care in Hospitals in Scotland in 2003 ensured that under-nutrition was highlighted as a key issue at NHS Board level in every locality (see Table 4.14 for a summary of the standards).
Overview of some key milestones in the evolution of strategies to improve nutritional care in Scotland
Summary of Clinical Standards for Food, Fluid and Nutritional Care in Hospitals, NHS Quality Improvement Scotland 2003
| Standard | Standard statement |
|---|---|
| 1. Policy and Strategy | Each NHS Board has a policy and a strategic and coordinated approach, to ensure that all patients in hospitals have food and fluid delivered effectively and receive a high quality of nutritional care. |
| 2. Assessment, Screening, and Care Planning | When a person is admitted to hospital, an assessment is carried out. Screening for risk of undernutrition is undertaken, both on admission and on an ongoing basis. A care plan is developed, implemented, and evaluated. |
| 3. Planning and Delivery of Food and Fluid to Patients | There are formalised structures and processes in place to plan the provision and delivery of food and fluid. |
| 4. Provision of Food and Fluid to Patients | Food and fluid are provided in a way that is acceptable to patients. |
| 5. Patient Information and Communication | Patients have the opportunity to discuss, and are given information about, their nutritional care, food, and fluid. Patient views are sought and inform decisions made about the nutritional care, food, and fluid provided. |
| 6. Education and Training for Staff | Staff are given appropriate education and training about nutritional care, food, and fluid. |
- Performance assessments of standards 1, 2, and 6 in 2005–2006 revealed that work had begun, with many NHS Boards having made progress with implementing screening. Work was still needed, especially education and training.
- A range of innovative strategies was subsequently developed to help NHS Boards to implement the guidelines. A multi-agency Integrated Programme for Improving Nutritional Care in Scotland was established, funding for Nutrition Champions was made available by the Scottish Government, and a Core Nutrition Pathway (Figure 4.6) and an Education Framework for Nutritional Care were developed. Patients’ views were also sought.
- These structured approaches are well-aligned with international best practices; for example, hospital-wide nutrition programs that integrate routine screening and individualised care planning have been shown to reduce complications and improve survival in at-risk inpatients. 95 Best practice guidelines also recommend systematic staff education to optimize screening and nutritional intervention outcomes. 87
- In 2009, each NHS Board undertook a local self-assessment followed by an external peer review visit to assess performance against standards 1, 2 and 6 and a full report against standards 3, 4 and 5. The national overview and local reports are available here. The national overview report also includes examples of good practice.
- After the first review, 5 challenges were set for NHS Boards, and progress against these, as described in the national report, is listed below:
- implementing nutritional assessment, screening and care planning by 2009: this has been achieved by almost every NHS Board in Scotland;
- planning and implementing improved care for patients with complex nutritional needs: this has been achieved by most NHS Boards, although some organisations find it challenging to formalise access to all key members of the complex nutritional care team;
- including nutritional care in job/personal development plans (as appropriate): this has been achieved across Scotland;
- demonstrating leadership commitment and reporting to the Board: this has been achieved in every NHS Board;
- ensuring budgets and resources are allocated to underpin improvement: nutritional care is clearly funded across NHS Scotland. However, while it is relatively straightforward to budget for catering and supplement requirements, it is less easy to define and cost clinical requirements.
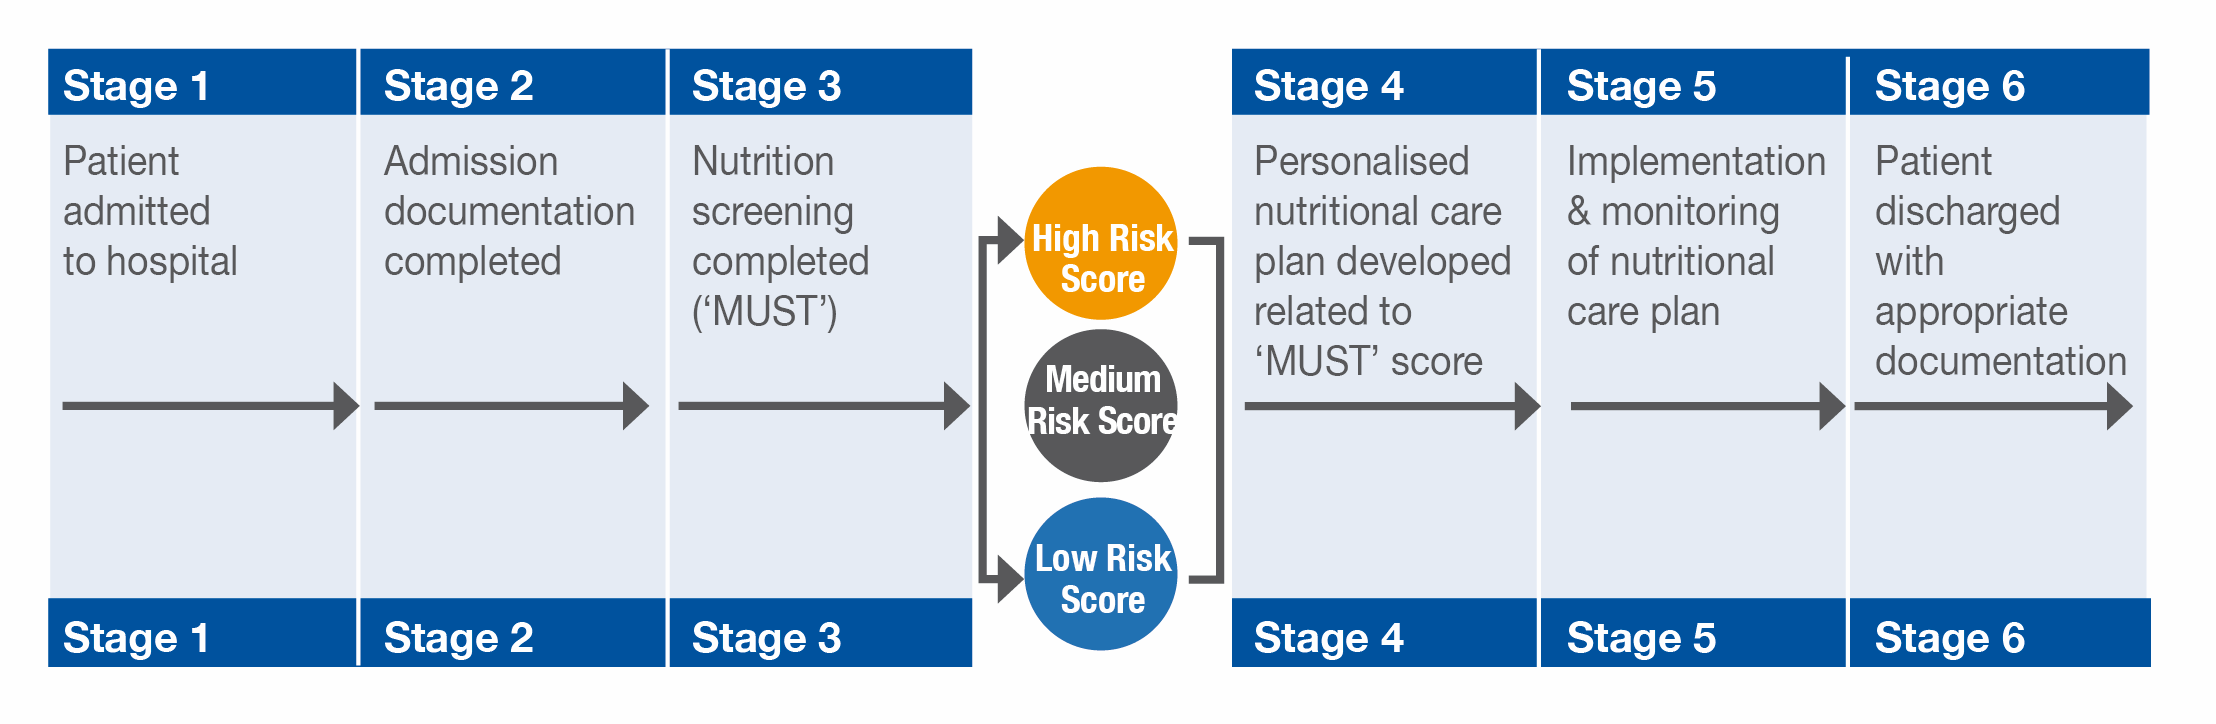
The Core Nutrition Pathway(adapted from NHS Education for Scotland, NHS Quality Improvement Scotland 2008)
- The Improving Nutritional Care Programme is under the remit of the Healthcare Improvement Scotland Patient Safety Programme. It is the second phase of the Integrated Programme for Improving Nutritional Care. It builds on progress to date by undertaking targeted improvement activities to improve nutritional care for people at risk of malnutrition in identified priority areas as outlined in Figure 4.7.
- The Nutrition Champions have a key leading role; learning sessions have been delivered to build capacity and capability, and a series of initiatives have been put in place to gather and share experience. Full details including resources are available at http://www.knowledge. scot.nhs.uk/improvingnutritionalcare.aspx
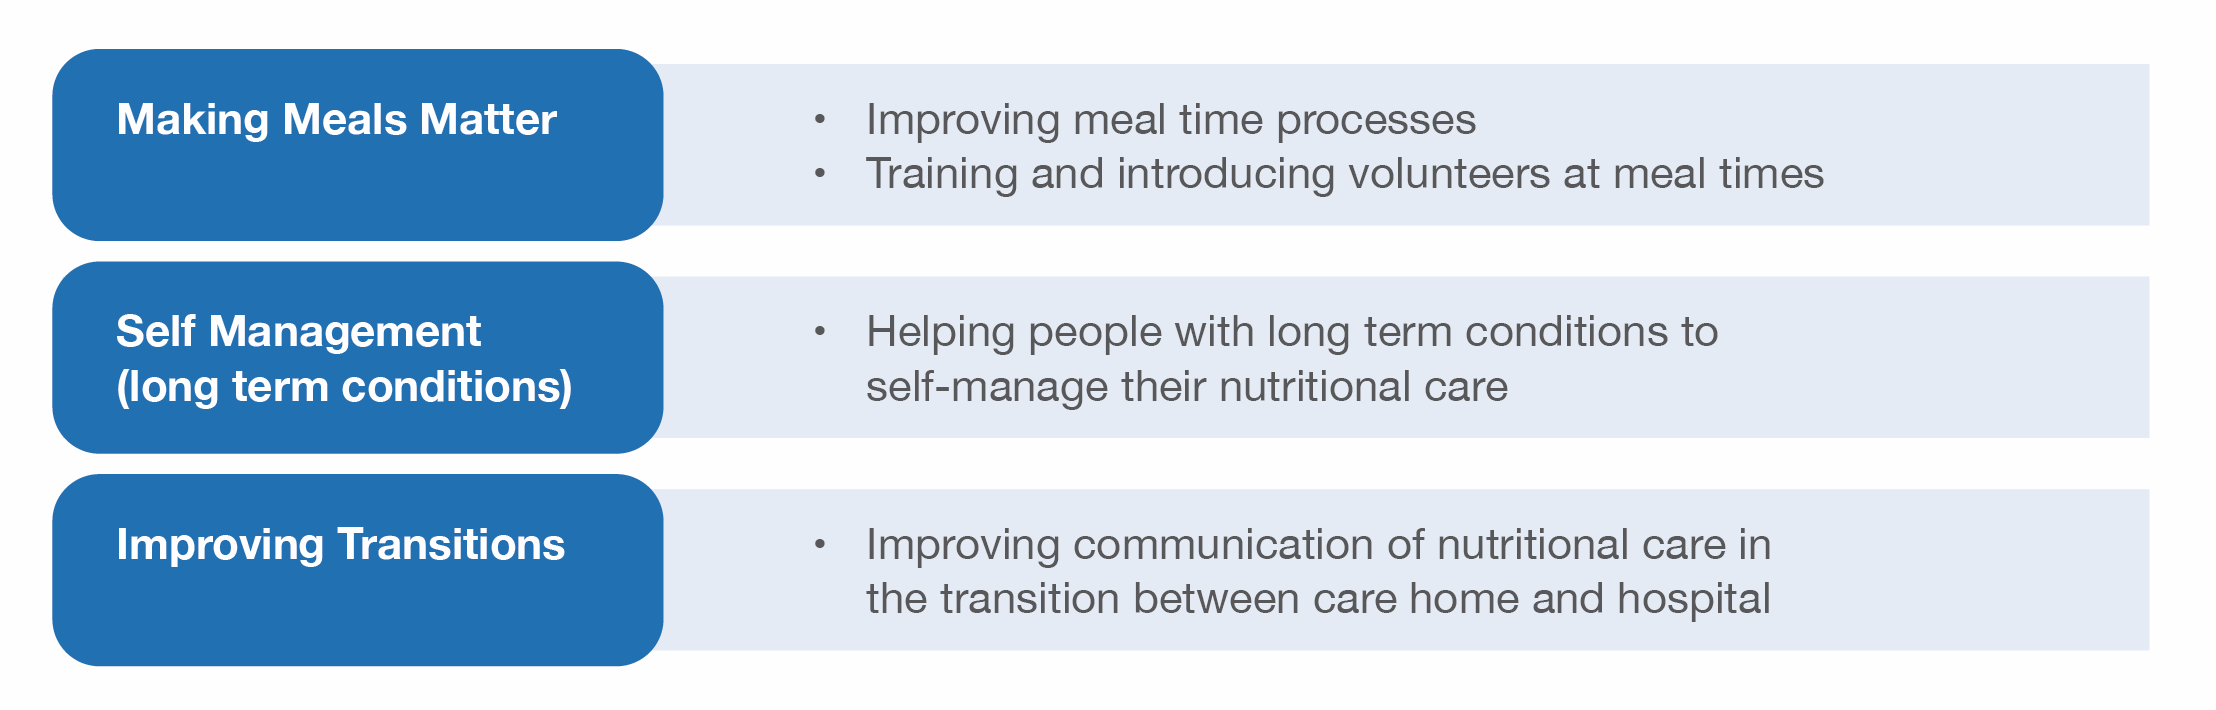
The Improving Nutritional Care Programme priority areas(adapted from Health Improvement Scotland, ‘Improving Nutrition… Improving Care’ March 2012)
Implementation in practice: A national example – The Netherlands
In the Netherlands, screening for malnutrition is mandatory in hospital (including children) and in nursing and residential homes. Figure 4.8 illustrates the events that led to this change.
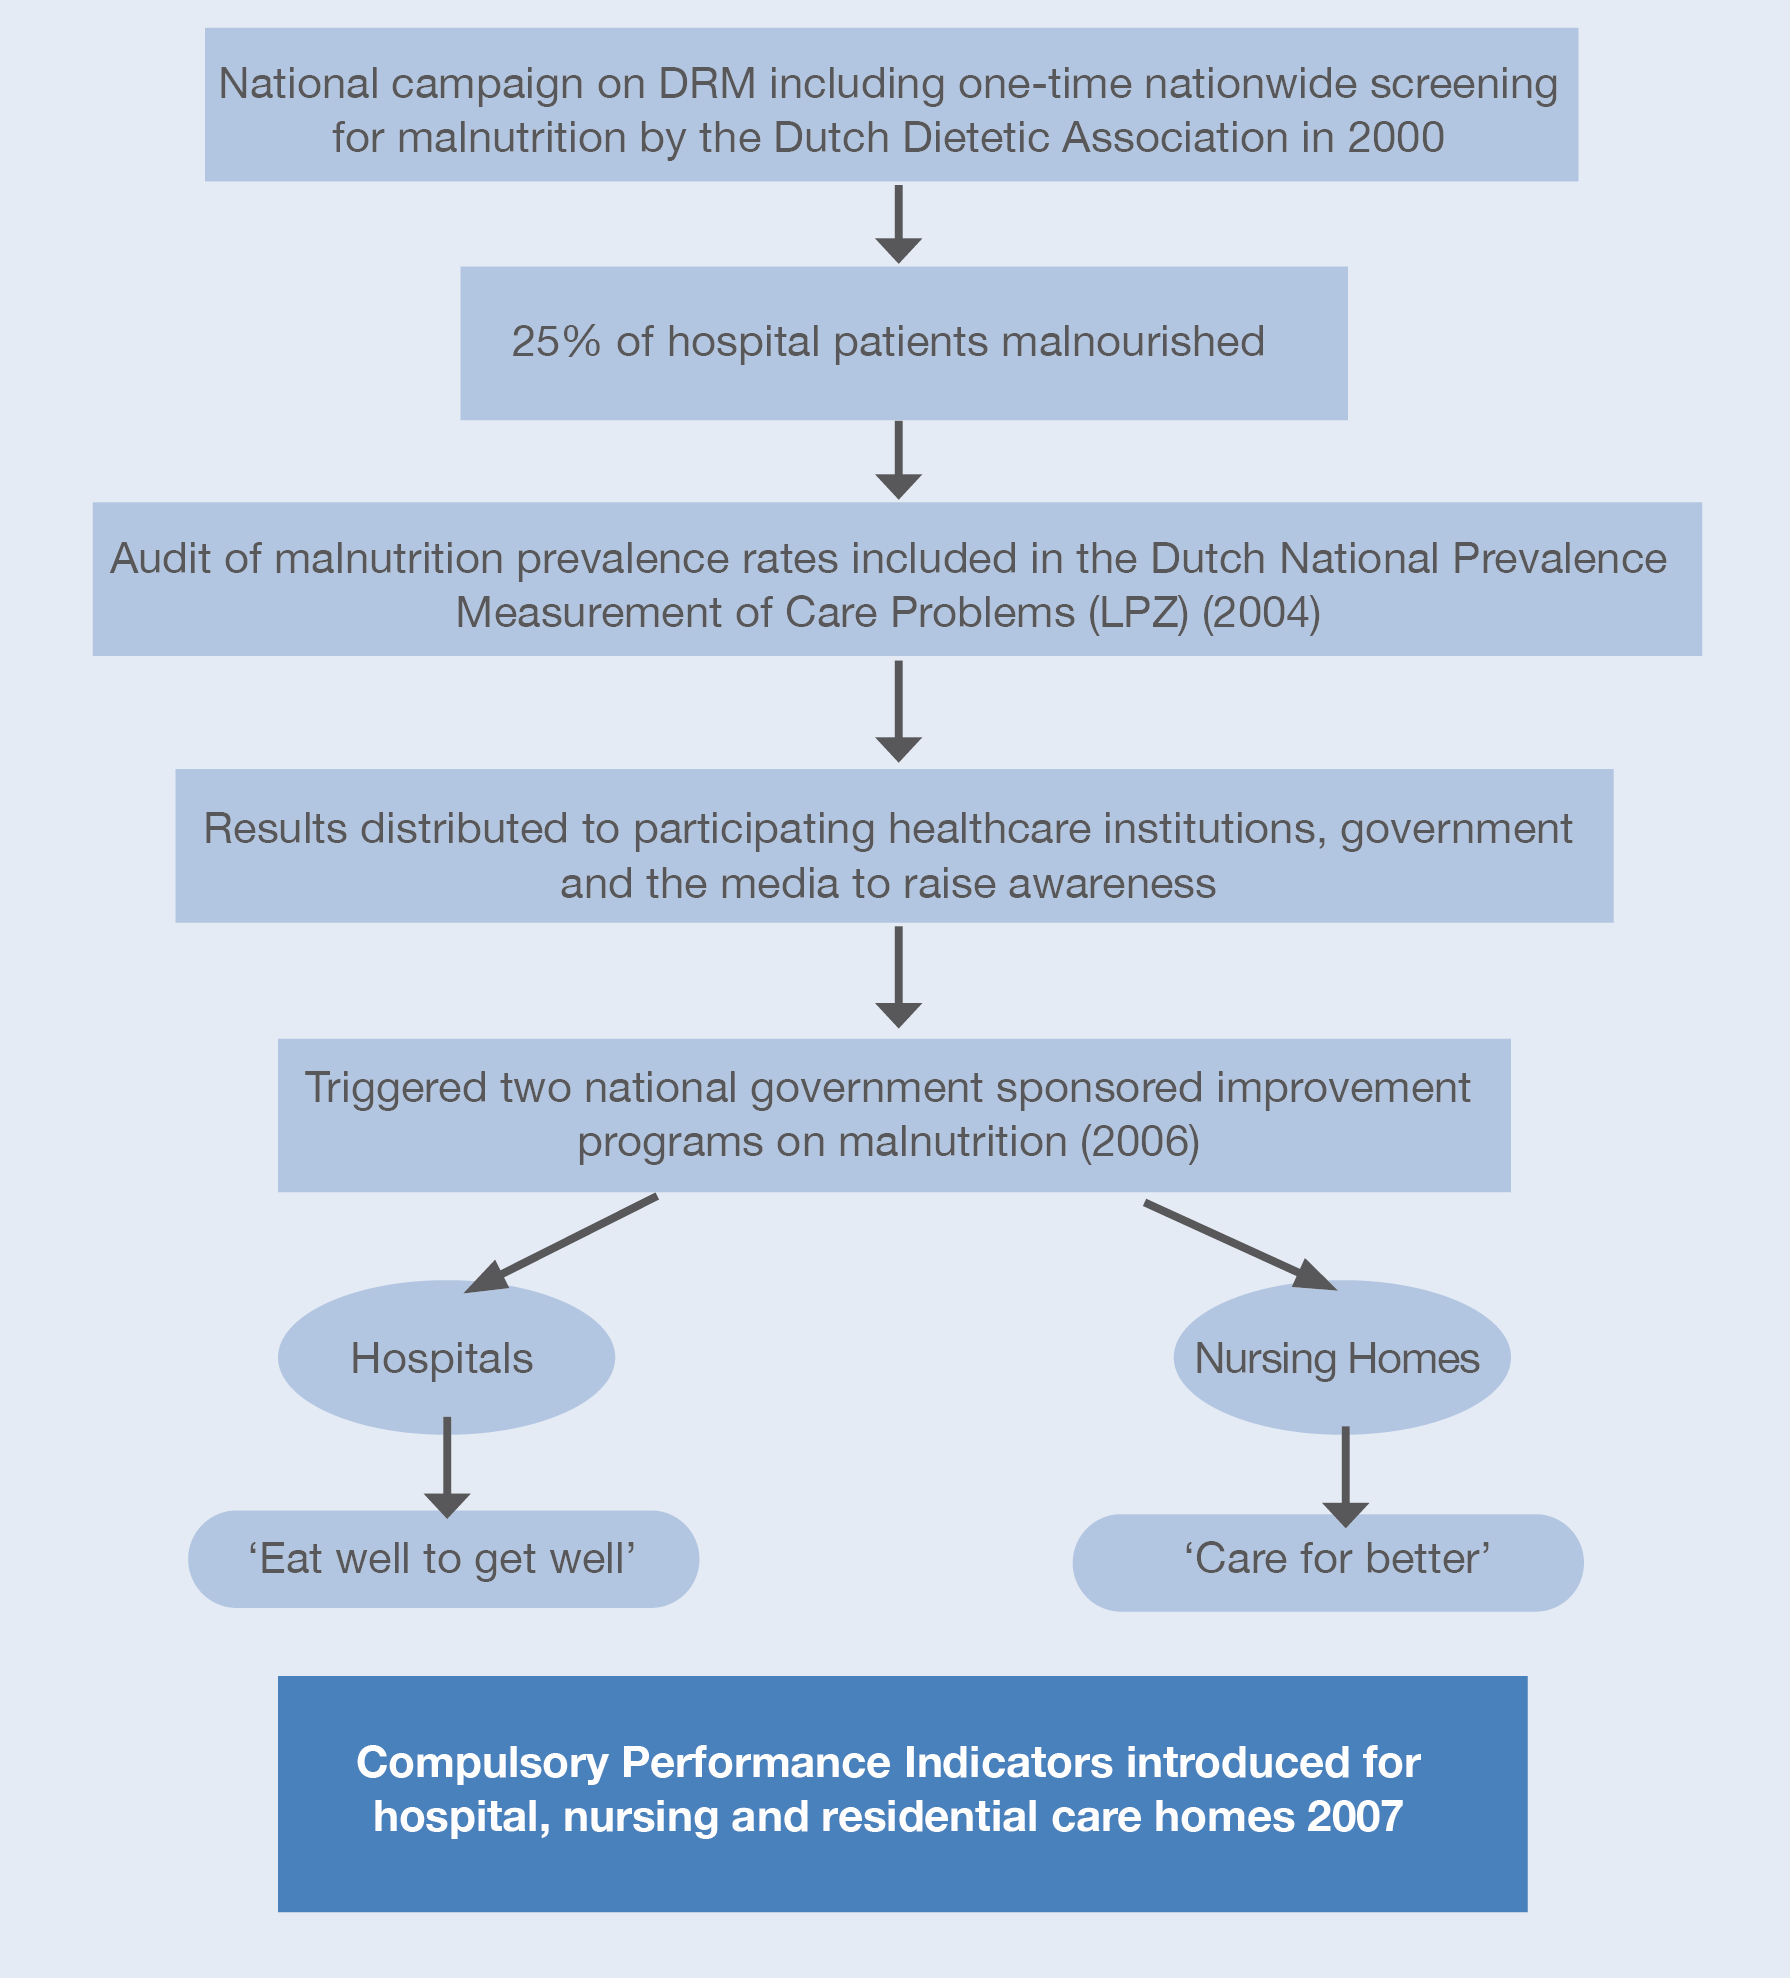
Evolution of strategies to tackle malnutrition in the Netherlands96(LPZ: Landelijke Prevalentiemeting Zorgproblemen)
- An analysis of the results from national audits conducted in The Netherlands from 2004 to 2010 shows that the prevalence of malnutrition decreased (Figure 4.9). Furthermore, the more often hospitals and home care organisations participated in the annual audits, the lower the prevalence of malnutrition (p <0.001). Participation in the national improvement programmes also resulted in lower prevalence rates (p = 0.027), suggesting that increasing awareness and actively working towards improvement could be important in lowering the rate of malnutrition.96
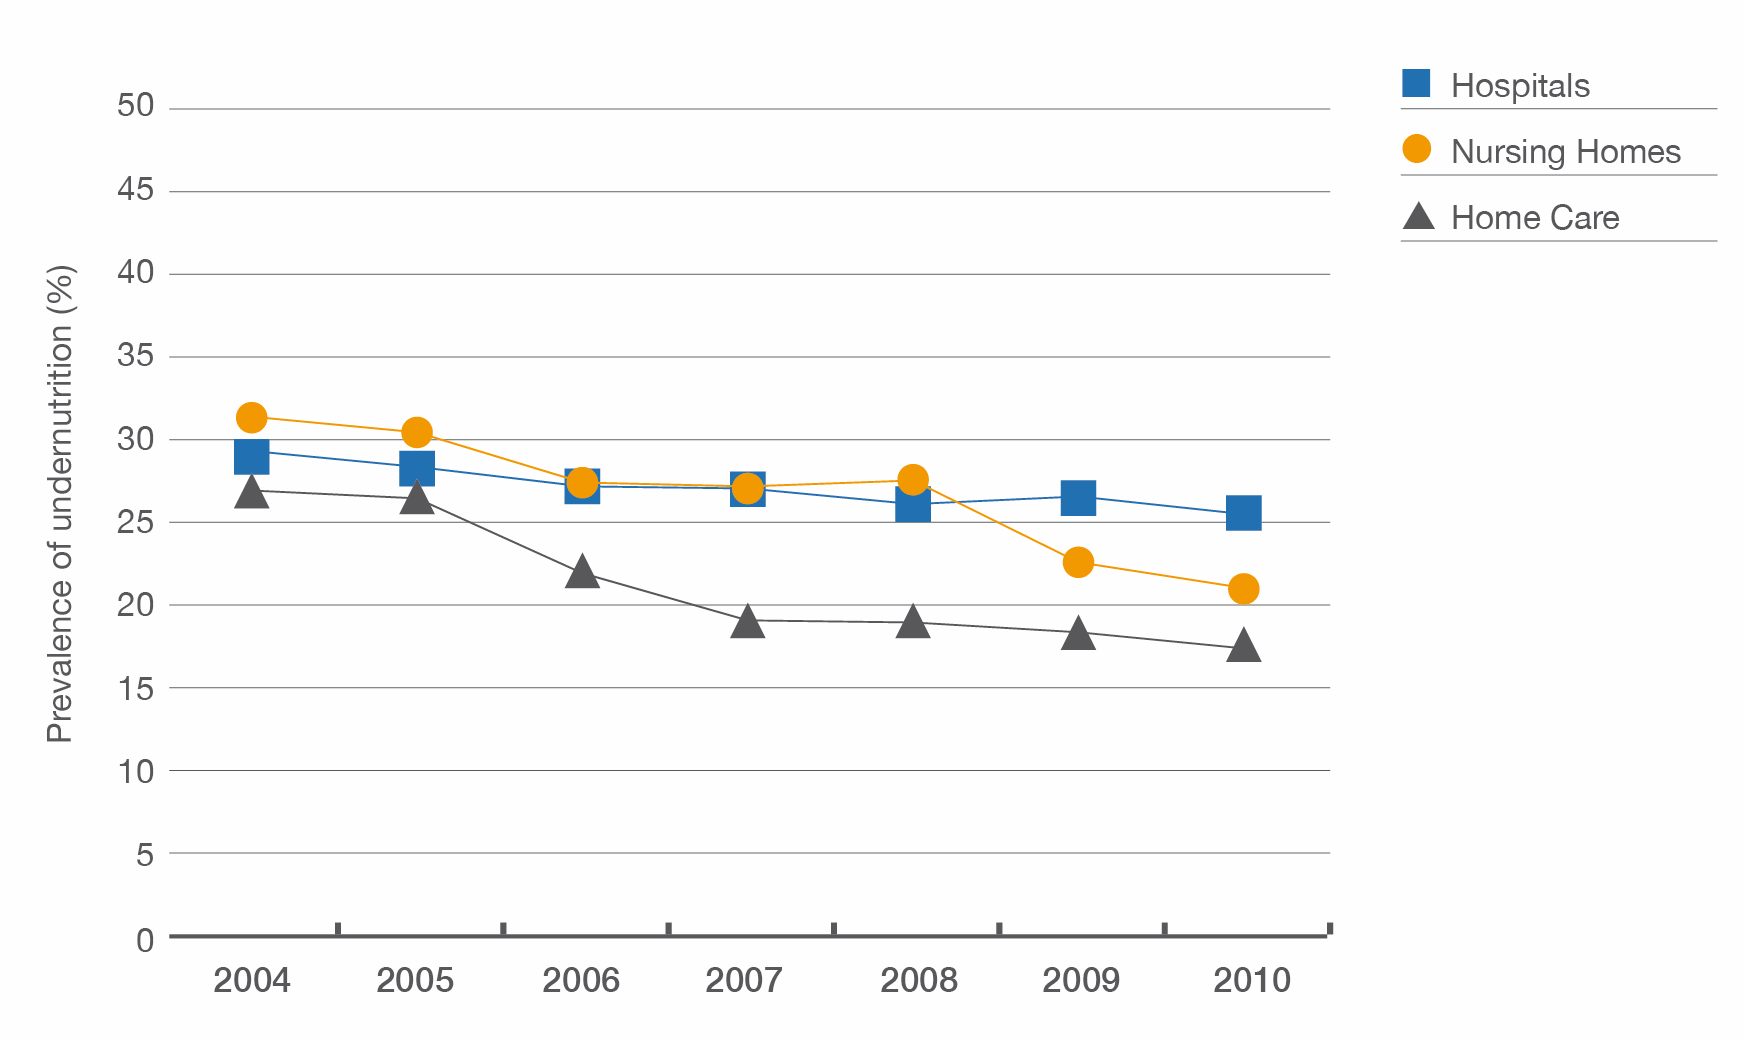
Malnutrition prevalence rates from 2004 to 2010. LPZ
- Extensive information about the Dutch approach, including details of methodology, implementation strategies and toolkits, is available on the Fight Malnutrition website at http://www.fightmalnutrition.eu/. The following 10 steps summarise the Dutch approach:
- a multidisciplinary steering group with national key people;
- up-to-date prevalence data to create and sustain awareness;
- quick and easy screening tools with treatment plans;
- screening as a mandatory quality indicator;
- evidence-based validated tools and cost-effectiveness research;
- Ministry of Health as a key stakeholder;
- implementation of projects in all care settings;
- toolkit with free accessible half fabricates and best practices;
- multidisciplinary project teams in all institutions;
- training programmes and workshops.