
1.2.2 Community
Malnutrition is common in outpatients
- Between 7% and 16% of patients across hospital general outpatient departments have been found to be malnourished or at risk of malnutrition (see Table A1.3, Appendix 1).78,162,163
- The prevalence varies considerably depending on the department:
- A large multi-centre study in the Netherlands (n = 2288, 9 hospitals) found the highest prevalence of malnutrition in oral maxillofacial surgery outpatients (17%), although this could be an underestimate as no patients with head and neck cancer were present on the day of the survey (see Figure 1.16);78
- In a study of 1,000 outpatients with cancer in Italy, 39.7% were found to have experienced significant weight loss (≥ 10%) and 33.8% were found to be at nutritional risk.164 A small study (n = 207) of medical oncology outpatients in a UK hospital found that the prevalence of risk of malnutrition ranged from 45% to 83% depending on the tumour site165 (see Table A1.3, Appendix 1 for details);
- In a study of 296 oncology outpatients (mean age 58.3 years, 70.3% female) at Izmir Katip Celebi University in Turkey, 43.9% were at risk of malnutrition, and 16.2% were malnourished according to the MNA. Breast (43.2%) and gastrointestinal (33.1%) cancers were the most common tumour types.166
- A secondary analysis of data from 188 patients with head and neck cancer (HNC) revealed a malnutrition prevalence of 22.6% using GLIM criteria.167
- Depending on the severity of disease, as many as 1 in 499 outpatients with Chronic Obstructive Pulmonary Disease (COPD) are malnourished or at risk of malnutrition;169,170 In addition, a meta-analysis assessing the global prevalence of malnutrition in patients with COPD found that the prevalence of malnutrition was 30.0% (95% CI 20.3 to 40.6), compared with an at-risk prevalence of 50.0%,170
- About 1 in 3 adult gastroenterology outpatients have been identified as at risk of malnutrition;171
- A study conducted in the medical and surgical gastroenterology outpatient department of a UK hospital (n = 605) found a 14% prevalence of malnutrition, assessed using BMI and weight loss (%WL) according to MUST. Patients with IBD (18%) and cancer (25%) showed the highest prevalence of malnutrition (p < 0.05).172
- A study of older people attending a geriatric medical outpatient clinic in Turkey found that 28% were at risk of malnutrition (using MNA).173
- Using different assessment methods, another study in older adult outpatients in Turkey (n = 252, mean age 68 years, 61% females) found that malnutrition prevalence varied significantly depending on the assessment method: 32.2% with the GLIM criteria, 12.7% with the MNA long form (MNA-LF), and 13.1% with the MNA short form (MNA-SF).11 A systematic review and meta-analysis of studies examining the prevalence of malnutrition in older people in outpatients (n = 37) (malnutrition was identified using the Mini Nutritional Assessment (MNA®) criteria), showed a prevalence of malnutrition (MNA <17 points) of 6% (95% CI, 4.6-7.5) and a prevalence of risk of malnutrition (MNA 17-23.5 points) of 30.9% (95% CI, 26.2-35.5). The authors highlighted that there was significant heterogeneity in individual study results.126
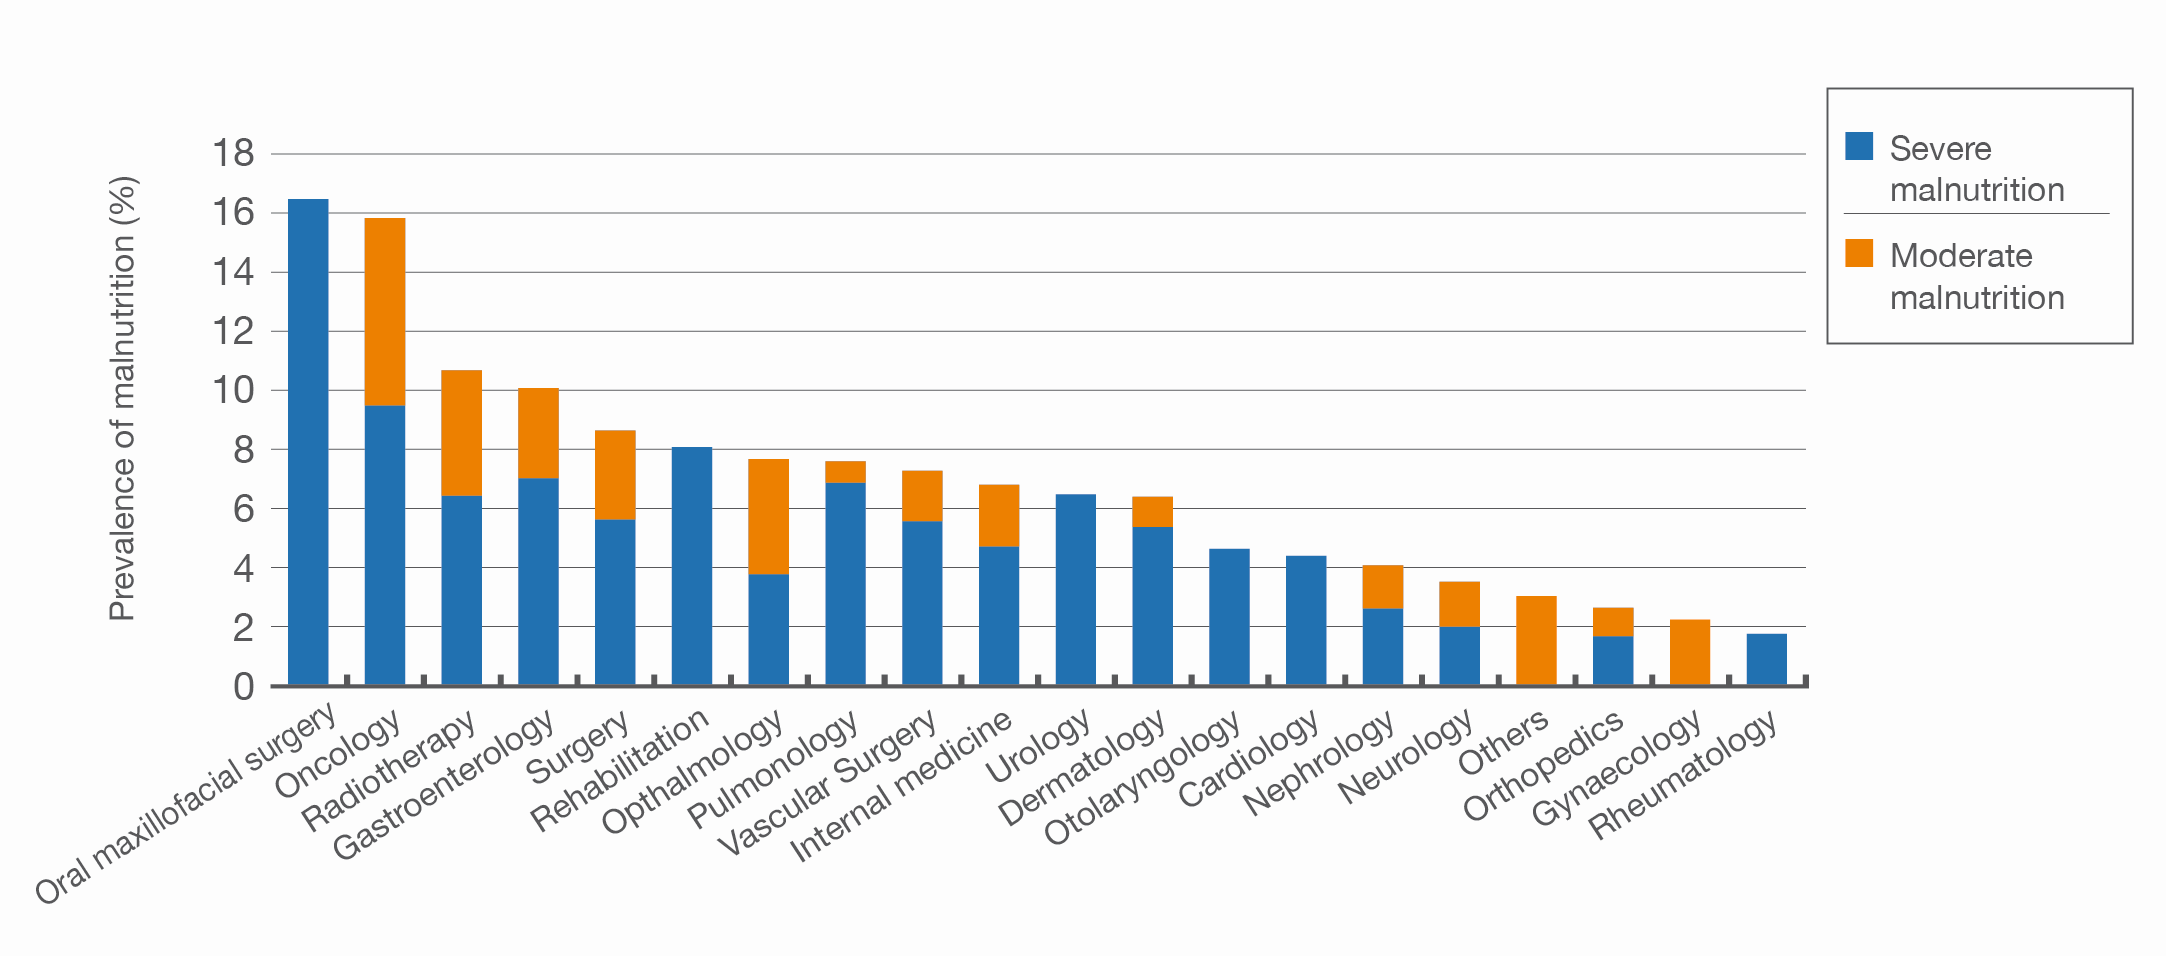
Prevalence of malnutrition in outpatient departments in the Netherlands (n = 2288). 78
Others: psychiatry, radiology, geriatrics and physiotherapy (see Table A1.3, Appendix 1 for details)
Malnutrition is found to be common in people with intellectual disability and mental health problems
- In UK adults aged 20 years and over with intellectual disability, the prevalence of underweight (BMI ≤ 20 kg/m2) has been shown to be 18.6%.174 Rotenberg et al. examined data from 220,621 children aged 2–4 years across 30 countries, including 15,071 children with disabilities (6.6%). They found that children with disabilities had a higher likelihood of stunting (95% CI: 1.11 – 1.20), wasting (95% CI: 1.18 – 1.39), and being underweight (95% CI: 1.17 – 1.51) compared to children without disabilities.175 The UK Nutrition Screening Week Survey 2011 found a prevalence of malnutrition risk in patients in mental health units (n = 543) of 19% (Table A1.7, Appendix 1).72
- In Taiwan, a study by Tsai et al. found that the prevalence of malnutrition and malnutrition risk (using MNA-Taiwan version) in patients in mental health units differed with different diagnoses as follows:176
- 12.5% in patients with bipolar disorder;
- 21.1% in patients with schizophrenia;
- 55.6% in patients with major depression.
- The pooled prevalence of obesity in people with severe mental illness (SMI) was 25.9% (95% CI: 23.3–29.1), while the combined prevalence of overweight and obesity was 60.1% (95% CI: 55.8–63.1). Despite the focus on obesity, malnutrition, including undernutrition, also remains a concern in people with mental disorders, highlighting the complex interplay between mental health and nutritional status.4
 More than 1 in 3 patients in care homes are malnourished or at risk of malnutrition
- There is currently no general screening tool that can predict the clinical outcome in every patient group in all care settings, due to the heterogeneity of the disease within patient groups and treatment settings.177
- Estimates using a variety of methods in different types of care homes (majority of participants were older people) suggest that between 9% and 97% of residents in long-term care facilities are at risk of malnutrition or already malnourished (see Figure 1.17) (Table A1.4, Appendix 1). Figures at the lower end of this prevalence range are reported in studies where prevalence of malnutrition or malnutrition risk was assessed either by using a healthcare professional’s subjective assessment or BMI; 178-180 both of these methods are known to underestimate the prevalence of malnutrition risk. An exception was residential homes in the Republic of Ireland which reported a prevalence of malnutrition risk using ‘MUST’ of 9% and 0% in 2010 and 2011, which contrasts starkly with the results for the UK for the same years (30% and 41% respectively).72,101 There may be differences between the two countries in the type of residents cared for in these facilities; however, it must also be noted that in the Republic of Ireland the sample sizes were small, with very low numbers of patients participating per care home (2010: n = 143 [17 care homes], 2011: n = 29 [6 care homes]), meaning that the results may not be representative of the actual level of malnutrition risk in residential homes in the Republic of Ireland.
- Prevalence figures at the upper end of the range are reported in studies where MNA or MNA-SF was used.178-188 In many of these studies, the subjects differed in terms of age, type of care home, and underlying condition, and some included small sample sizes (see Table A1.4, Appendix I).
- Based on large studies (n > 1000) using a validated screening tool (MNA or ‘MUST’), more than 1 in 3 patients (30–53.4%) living in care homes are at risk of malnutrition81,104,124,178,189(see Table 1.8).
Summary of large-scale studies of the prevalence of malnutrition and risk of malnutrition in patients in care homes (n > 1000; using a validated screening tool; majority of participants were older people
| Country / Region | Author (year) | Patients (n) | Timing of nutritional assessment / screening (data collection) | Prevalence % | Method of assessment / screening |
|---|---|---|---|---|---|
| International† | Kaiser et al. (2010) 124 | 1586 | Not available | 67.2 (53.4 at risk, 56.7 malnourished) | MNA |
| Finland | Suominen et al. (2009) 178 | 1043 | All patients during 2 weeks in September 2003 | 97.4 (40.7 at risk, 56.7 malnourished) | MNA |
| Hungary | Lelovics et al. (2009) 189 | 1381 | Timing of assessment not clear | 38.1 | ‘MUST’ |
| UK | Parsons et al. (2010) 81 | 1176 | Timing of assessment not specified | 39 | ‘MUST’ |
| UK | Russell et al. (2008) 104 | 1610 | Restricted to adults admitted within the previous 6 months | 30 | ‘MUST’ |
†Retrospective pooled analysis of data from studies in older people in nursing homes in Switzerland, Germany, Spain, France, The Netherlands, the United States and South Africa
- A study conducted in care homes in Lincoln, UK, assessed the prevalence of malnutrition among 527 residents using two validated screening tools: the Mini Nutritional Assessment-Short Form (MNA-SF) and the Malnutrition Universal Screening Tool (MUST). The prevalence of malnutrition risk was found to be 41.4% with MNA-SF and 25.5% with MUST, demonstrating a significant variation based on the tool applied.190
- A systematic review and meta-analysis examining malnutrition in individuals with dementia found the pooled prevalence of malnutrition to be 26.98% (95% CI 22.0–32.26, p < 0.0001) and the risk of malnutrition to be 57.43% (95% CI 49.39–65.28, p < 0.0001). Variability in prevalence was attributed to differences in populations, study settings, and tools used for assessment.191
- A global meta-analysis of 16 studies involving 6,513 older adults, with dementia found that 32.52% were malnourished, while 46.80% were at risk of malnutrition.192 Studies in the UK using ‘MUST’ show that the risk appears to increase with increasing dependency (35–46% in nursing homes vs 22–36% in residential homes) (see Table A1.4, Appendix 1). In a study of the prevalence of risk of malnutrition in a Primary Care Trust in England (n = 703), a significantly higher prevalence was found in nursing care compared with residential care (38% vs 25%, p = 0.001).82 The prevalence of malnutrition (using SGA) was found to be higher in residents receiving a higher level of care in aged care facilities in Australia (OR 2.9 [95% CI 1.7–5.2; p < 0.001]).193
- A systematic review and meta-analysis of studies examining the prevalence of malnutrition in older people in a variety of community care facilities (malnutrition was identified using the Mini Nutritional Assessment (MNA®) criteria), showed a high prevalence of malnutrition (see Table 1.9).126
Prevalence of malnutrition in older people in a variety of community care facilities86
| Setting | Studies (n) | Malnourished (MNA < 17 points) % (95% CI) | At risk of malnutrition (MNA 17-23.5 points) % (95% CI) |
|---|---|---|---|
| Nursing home | 44 | 17.5(14.3-20.6) | 48(44.2-51.8) |
| Long-term care | 23 | 28.7(21.4-36.0) | 49(43.6-54.4) |
| Rehabilitation and sub-acute care | 15 | 29.4(21.7-36.9) | 48.5(42.4-54.6) |
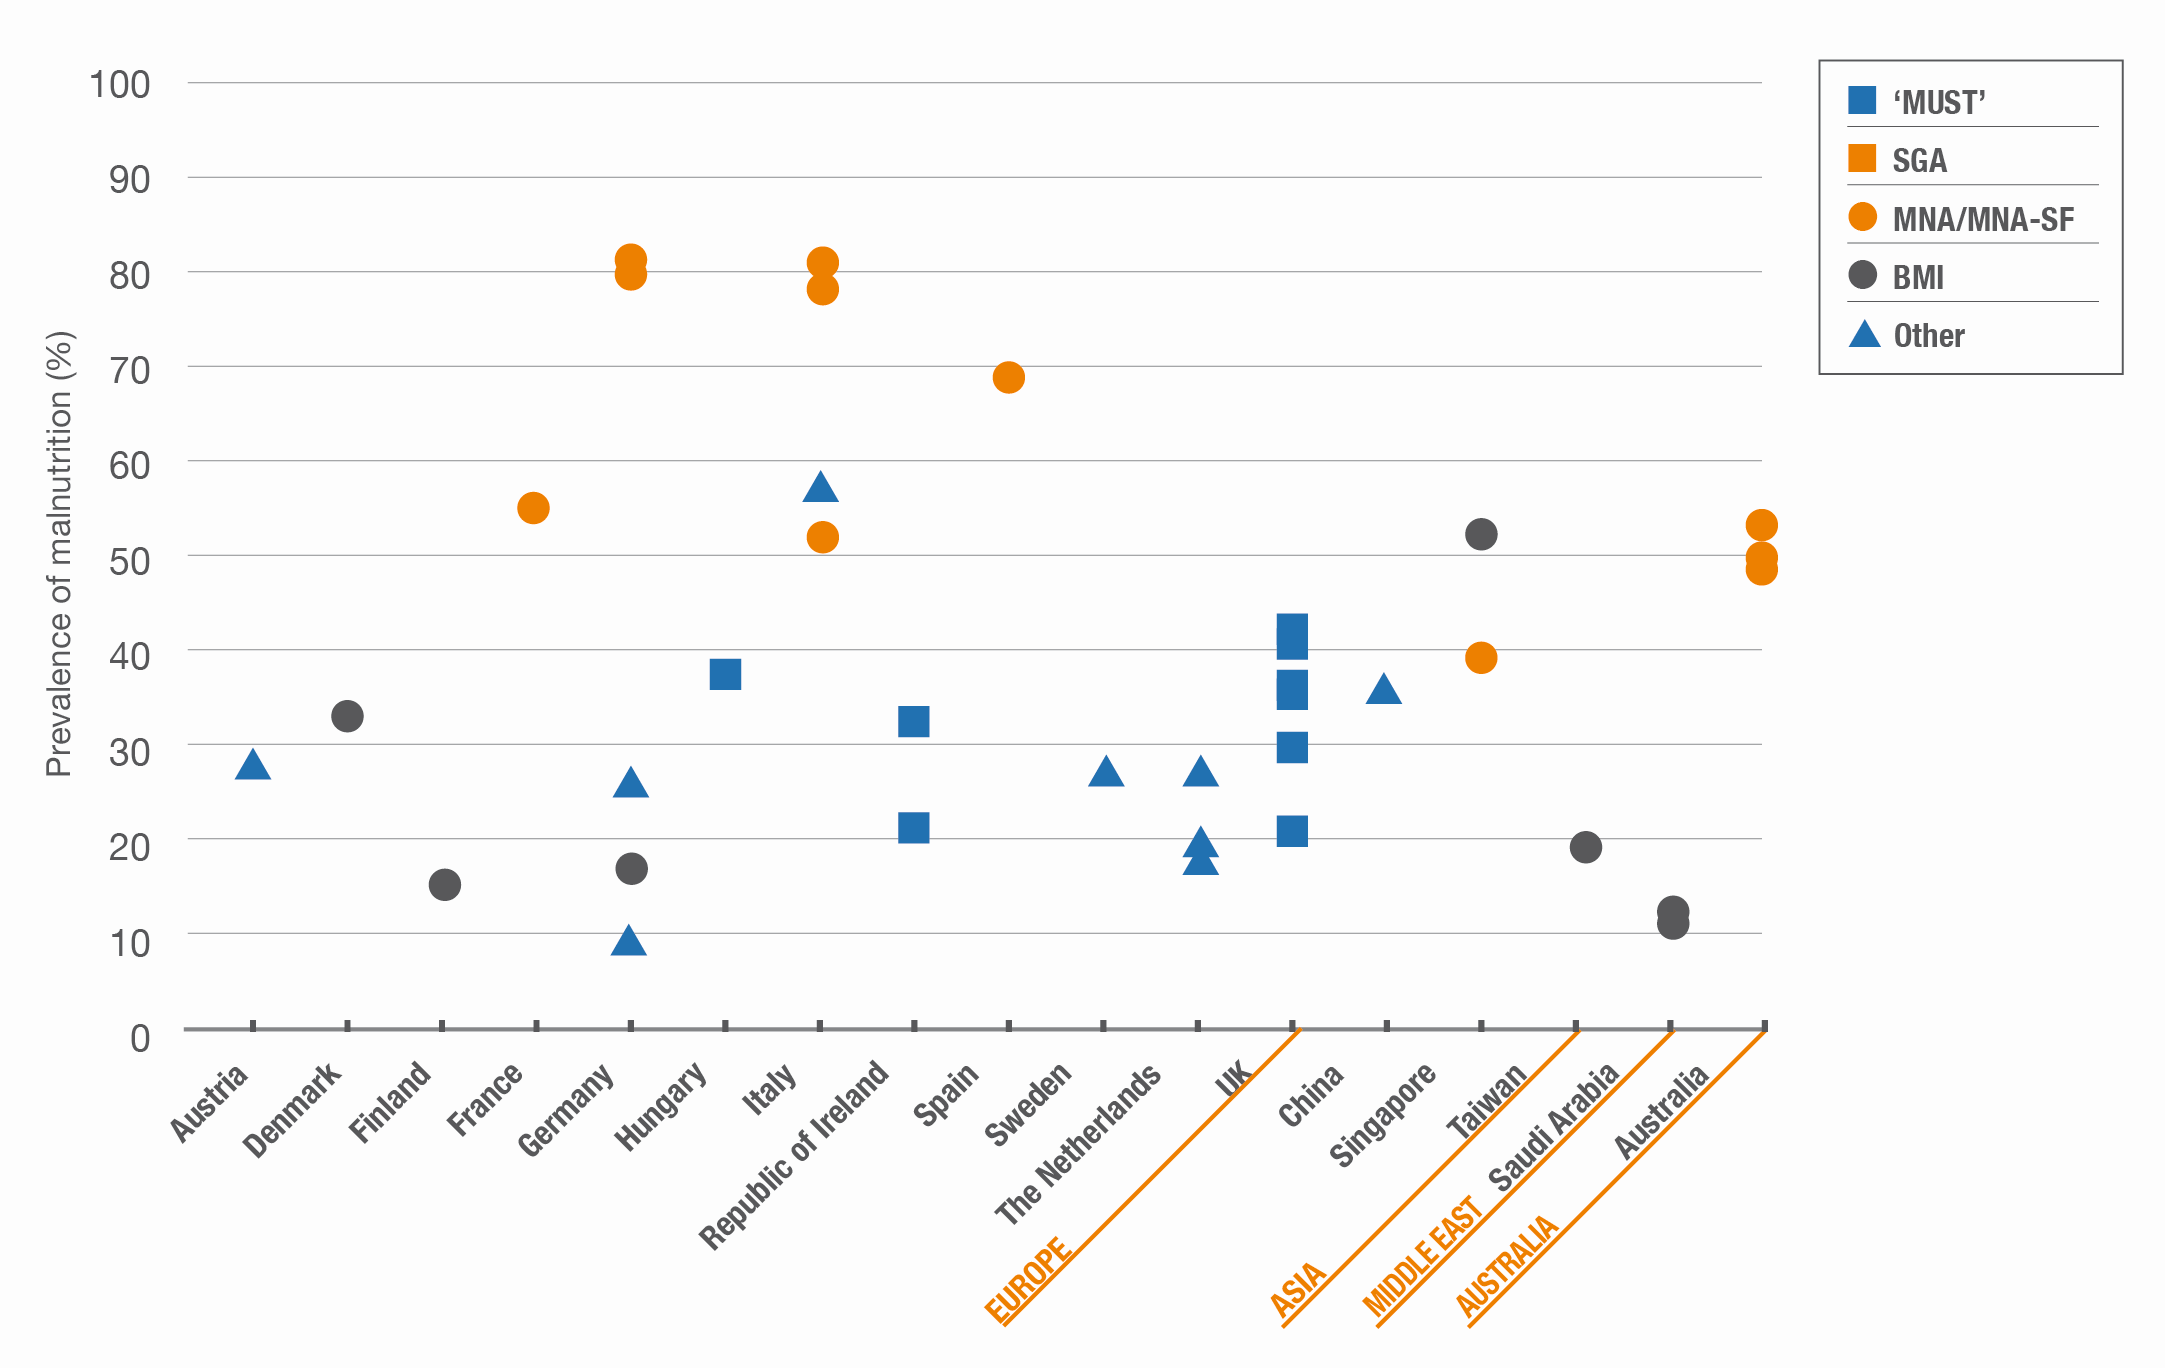
Prevalence of malnutrition risk in care homes using different screening methods by country and world region
(see Appendix I, Table A1.4 for full details)
As many as 1 in 3 older people living independently face the same risk
- Malnutrition is not just found in older people (the age of subjects differs in different studies but in general, people aged over 60 years or 65 years are included) in hospitals and care homes; free-living older people are also at risk of malnutrition. As with other settings, the prevalence varies depending on the method used (2–52%) (see Table A1.6, Appendix 1) and the type of subjects studied, including disease status. Special efforts should be made to identify these people since they may not all be in regular contact with health or social care professionals, meaning that malnutrition could easily be missed.
- The prevalence of malnutrition as defined by the ESPEN consensus was 7.3% in healthy older community-dwelling women.194
- A study investigated the impact of malnutrition and its associated risk on healthcare utilization and costs among 1,660 older adults in the Toledo community (Spain). The analysis revealed that over one in four participants were either malnourished (12.6%) or at risk of malnutrition (15%). These individuals tended to be older, to have lower functional status, and to present with more comorbidities compared to well-nourished counterparts. Malnutrition or its risk was linked to greater medication use, more hospital admissions, longer stays, and increased hospitalisation costs. The findings highlight the need for routine malnutrition screening and nutritional interventions to improve health outcomes and reduce healthcare expenditures.195
- A large, pooled analysis of previously published datasets of community-dwelling older people (n = 964, > 65 years of age) from 5 different countries (Switzerland, France, Japan, Sweden and South Africa) using MNA found that 31.9% of participants were at risk of malnutrition and 5.8% were malnourished.124
- Prevalence of risk of malnutrition of 12–14% (using ‘MUST’) has been found in residents in sheltered accommodation in the UK (see Table A1.5, Appendix 1) and 31–37% in recipients of meals on wheels in the UK and Ireland (using ‘MUST’ and MNA) (see Table A1.6, Appendix 1).196-198 Prevalence of malnutrition or risk of malnutrition of up to 90% using MNA has been found in older people resident in serviced flats in Sweden and Finland.199-201
- A systematic review and meta-analysis of studies examining the prevalence of malnutrition in older people in the community (n = 58) (malnutrition was identified using the Mini Nutritional Assessment (MNA®) criteria), showed a prevalence of malnutrition (MNA <17 points) of 3.1% (95% CI, 2.3-3.8) and a prevalence of risk of malnutrition (MNA 17-23.5 points) of 26.5% (95% CI, 22.4-32.7). The authors highlighted that there was significant heterogeneity in individual study results.126 There are few studies to date on the risk of malnutrition in patients attending general practices (family doctors), although emerging data indicates that the prevalence of malnutrition risk in older community-dwelling Dutch people attending general practices for influenza vaccination (identified using SNAQ) is 12%, and 10.8% in adults (mean age 41.8, SD±18.3) attending GP practices in areas with a high Multiple Deprivation Score in the UK (identified using ‘MUST’).202,203 A study in Denmark investigated the prevalence of unintended weight loss and reduced food intake in 1087 patients (≥18 years) attending common practices. Among respondents, 14.2% reported unintended weight loss within the previous two months, and 12.9% reported reduced food intake within the past week. Of those experiencing unintended weight loss, 62.3% also had reduced food intake. Higher odds of these issues were observed in younger (18–39 years) and older (>80 years) adults, underweight individuals, and those seeking care for chronic pain, mental discomfort, or suspicion of serious illness. Conversely, patients with obesity or visiting for general health check-ups had lower odds of these concerns. The findings highlight unintended weight loss as a practical indicator for initiating further nutritional screening in general practice.204
Risk of malnutrition is associated with level of dependency
- A systematic review and meta-analysis of studies examining the prevalence of malnutrition in older people according to healthcare setting (n = 240) (malnutrition was identified using the Mini Nutritional Assessment (MNA®) criteria), showed that across all healthcare settings both the presence of malnutrition and the risk of malnutrition were directly correlated with the level of dependence associated with the care setting (p < 0.001).126
 Malnutrition is common in patients with cancer
- When considering the issue of malnutrition in cancer, it is important to note that the terms malnutrition and cachexia are often used interchangeably due to differing definitions of cancer cachexia.205 In addition, it can be difficult to separate the effects of cachexia and the effects of cancer treatment as a cause of malnutrition.205 The approach used in a recent review of the effect of malnutrition on cancer patients by Henry (2011) will be employed here, i.e. ‘the term “malnutrition” is used to describe the changes in nutritional status observed in cancer patients’.205
- Cancer patients are at a high risk of developing malnutrition and -especially in advanced stages of the disease – deleterious metabolic alterations. Malnutrition, when detected by a number of different screening or other tools of varying complexity is frequent and has been reported to be present in 20–70% of cancer patients, depending on tumour entity, stage of disease and clinical setting.206
- A number of definitions of cancer cachexia have been proposed207-209 and a practical, easy-to-use classification of cancer cachexia has been developed (defined as ≥ 10% weight loss associated or not with anorexia, early satiation and fatigue; weight loss of < 10% is defined as pre-cachectic).210
- Cancer is a chronic condition often identified late, and it involves complex treatment regimens. Nutrition and malnutrition are often not seen as important by healthcare professionals and weight loss is incorrectly viewed as inevitable by patients and their families.
- In practice, the need to identify patients who are at nutritional risk or who are malnourished is an important aspect of good patient care, since cancer-related weight loss affects patients’ physical activity, morbidity, response and tolerance to treatment, survival, and quality of life.211
More than 1 in 3 patients with cancer are malnourished and they are at higher risk of malnutrition than other patient groups
- In a prospective observational multi-centre study conducted in French cancer centres (n = 1545 inpatients and patients admitted for 1 day [outpatients], median age 59.3±13.8 years, 23.4% aged ≥ 70 years), the overall prevalence of malnutrition was reported to be 30.9% (with 18.6% of cases classed as moderate malnutrition and 12.2% as severe).212 Table 1.10 shows the prevalence of malnutrition according to tumour type.
- In a study of 1,000 outpatients with cancer in Italy, 39.7% were found to have experienced significant weight loss (≥ 10%) and 33.8% were found to be at nutritional risk.164 A small study (n = 207) of medical oncology outpatients in a UK hospital found that the prevalence of risk of malnutrition ranged from 45% to 83% depending on the tumour site165 (see Table A1.3, Appendix 1).
- In a hospital-based multicentre cohort study conducted across 44 institutions in Brazil (n = 3061 older hospitalised cancer patients, mean age not specified, all aged ≥60 years), the prevalence of malnutrition was reported to be 33.4% using MNA-SF.213
- Not unexpectedly, the rate of malnutrition is more than twice as high in patients with malignant disease (n = 54) than in patients with non-malignant disease (n = 448) (50.9% vs 21.0%, p < 0.0001, assessed using SGA).214 The 2010 UK Nutrition Screening Week Survey similarly demonstrated a significantly increased risk of malnutrition in those with a cancer diagnosis (44% vs 32% without cancer, p < 0.001).93
Prevalence of malnutrition in expert cancer centes in France by tumour type (adapted from Pressoir 2010)137
| Tumour type | Overall prevalence of malnutrition % | Moderate malnutrition % | Severe malnutrition % | |||||||||
|---|---|---|---|---|---|---|---|---|---|---|---|---|
| Breast | 18.3 | 11.2 | 7.1 | |||||||||
| Head and neck | 45.6 | 22.5 | 23.1 | |||||||||
| Colorectal | 31.2 | 22 | 9.2 | |||||||||
| Haematological | 34.2 | 26.3 | 7.9 | |||||||||
| Upper digestive | 49.5 | 26.3 | 23.2 | |||||||||
| Gynaecological | 32 | 16.4 | 14.6 | |||||||||
| Lung | 40.2 | 21.9 | 18.3 | |||||||||
| Other* | 27 | 18 | 9 | |||||||||
|
Definitions of malnutrition used
|
|||||||||||
Patients with advanced cancer have a higher prevalence of weight loss and malnutrition
- As may be expected, studies confirm a higher prevalence of patients with weight loss and malnutrition with more advanced stages of disease. A Brazilian study showed prevalence of malnutrition across different cancer types according to stage, with 23% in Stages I–II, 21.9% in Stage III, rising to 62% in Stage IV cancers.215
- In the US, malnutrition prevalence is notably high in patients with advanced-stage cancer, with stage IV disease significantly associated with high malnutrition screening tool (H-MST) scores (OR 1.8, 95% CI 1.4–2.2, p < 0.001).216
- In a study of patients with locally advanced or metastatic cancer in Spain (n = 781, median age 62 years [range 19–92]) using a Patient-Generated Subjective Global Assessment (PG-SGA), more than 50% of patients with cancer were found to have moderate or severe malnutrition.217
- Sixty-eight percent of patients receiving palliative home care services in the Stockholm region were found to be at risk of malnutrition (based on modified NRS-2002), with prevalence ranging from 52% to 76% depending on the tumour site.218
- A study describing a retrospective review of presenting symptoms in 1,539 lung cancer patients also showed prevalence of weight loss at presentation (see Table 1.11).219
Prevalence of malnutrition in lung cancer patients according to cancer type and stage (adapted from Chute et al. 1985)142
| Cancer type | Stage | Prevalence of malnutrition % (assessed by weight loss) |
|---|---|---|
| Small-cell lung cancer | Limited disease Extensive disease |
35 52 |
| Squamous cell lung cancer | Stage I Stage II Stage III |
36 44 52 |
| Adenocarcinoma lung cancer | Stage I Stage II Stage III |
14 33 49 |
| Lung-cell lung cancer | Stage I Stage II Stage III |
13 52 45 |
1 in 2 patients with heart failure are at risk of malnutrition
- A global meta-analysis of 31 studies involving over 12,500 patients found that malnutrition affects 46% of those with chronic heart failure (CHF) and doubles the risk of death. The findings highlight the need for better nutritional management in CHF care to improve outcomes.220
1 in 4 patients with Parkinson’s disease is at a high risk of malnutrition
- A systematic review analysing 49 global studies involving 5,613 patients with Parkinson’s Disease found that 23.9% were at risk of malnutrition, while 11.1% were malnourished. Despite many patients being overweight or obese based on BMI, the findings highlight a significant prevalence of malnutrition, underscoring the need for more detailed research.221
- A meta-analysis of 16 studies across Europe, Latin America, and Asia, involving 1,650 patients with Parkinson’s disease found that 8.8% were malnourished, while 35.3% were at risk of malnutrition. The prevalence of nutritional disorders was 42.3%, with higher rates in developing countries. Disease duration, levodopa dose, disease severity, and motor symptoms were identified as key nutrition-related risk factors.222
1 in 4 patients with inflammatory bowel disease are malnourished
A multicentre, cross-sectional study of 295 inflammatory bowel disease (IBD) patients in Italy, found that 23% had disease-related malnutrition, with no significant differences between Crohn’s disease and ulcerative colitis. DRM was associated with factors like low BMI, current or recent hospitalisation, and higher disease activity. Additionally, 23% of patients had at least one micronutrient deficiency. The study highlights the need for routine nutritional assessment, particularly for patients with active disease or recent hospitalisations.223