
3.1.4.2 COST SAVINGS AND COST EFFECTIVENESS
 ONS can reduce the cost of overall hospital care by 12% (vs routine care)
- An economic model based on a systematic review of randomised trials has showed that nutritional support is a cost-effective way to reduce hospital length of stay and risk for readmissions, lower the frequency of hospital-associated infections, reduce admissions to nursing homes, reduce the number of medical examinations and prescriptions, and improve survival rates.119,120
- A health economic analysis conducted in 2015 by the National Institute for Health and Care Research and BAPEN showed that identifying and treating malnutrition according to the NICE guidance (CG32/QS24) can save at least ~£123,530 per 100,000 people or £308,820 per 250,000 people (approximate size of a CCG in England).121
- In a 2016 comprehensive systematic review of the cost and cost-effectiveness of using ONS in the hospital setting twelve studies were found to produce a net cost saving favouring the ONS group by an average of 12.2% (calculation of costs were based on bed- day costs). Twelve out of fourteen (86%) studies favoured the ONS group (see Table 3.2). Results of subgroup analyses according to age, nutritional status, type of intervention and type of analysis universally favoured the ONS group, although the number of studies was small.1
- A study of 2,028 medical inpatients at nutritional risk at eight Swiss hospitals found that individualised nutritional support reduced 30-day hospital costs from €27,439 to €27,240, saving €199 per patient (0.73%). Including dietitian costs, savings were €18.21 (0.066%). Cost reductions were driven by fewer ICU stays and complications, making nutritional support a highly cost-effective intervention despite modest direct savings.122
Post hoc analyses of hospital studies comparing ONS with no ONS or routine care. (Adapted from Elia et al. 2016)1
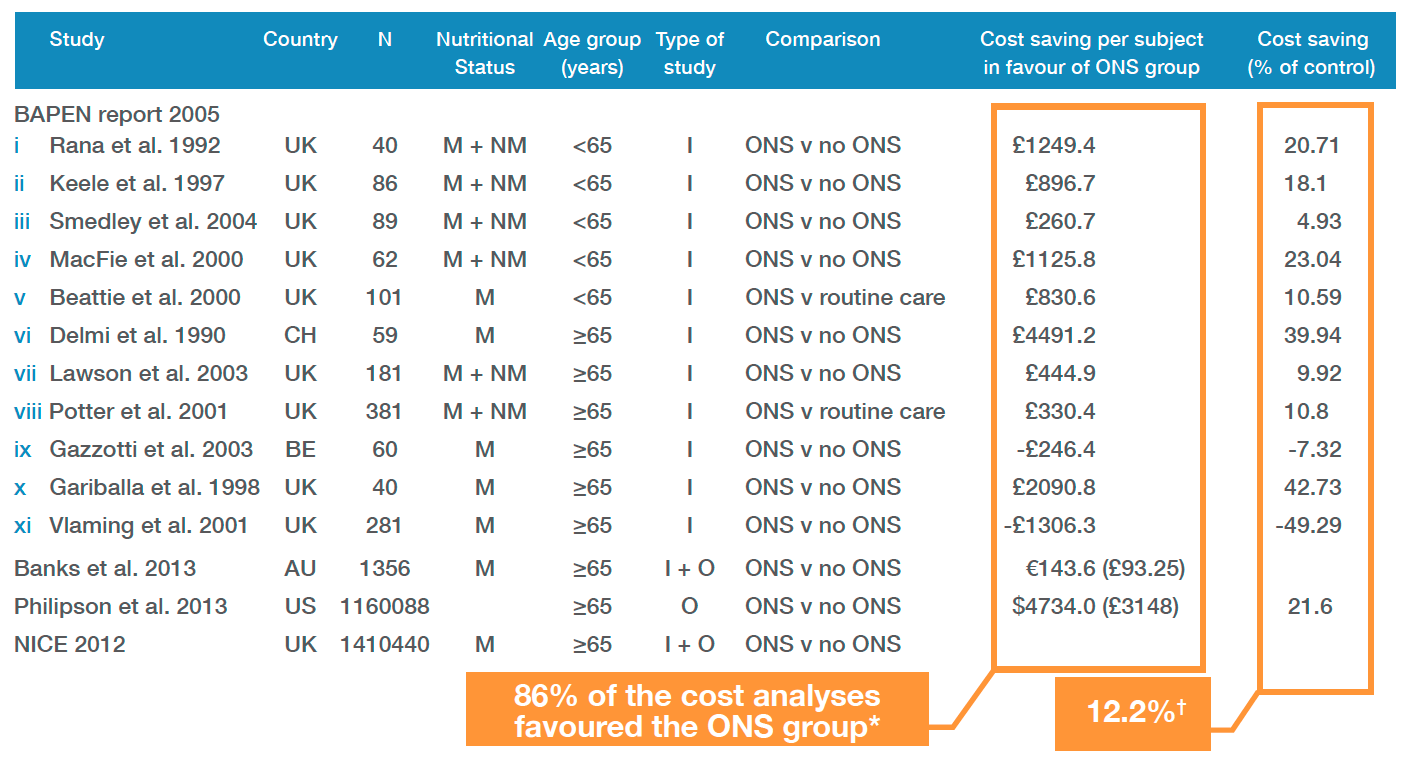
*12 of 14 cost analyses comparing ONS with no ONS or routine care. †Based on twelve studies with quantitative data. UK = United Kingdom; CH = Switzerland; BE = Belgium; AU = Australia; US = United States; M = malnourished; NM = non-malnourished; I = interventional study; O = observational study.
- A 2021 global systematic review and cost-effectiveness analysis based on 27 randomised trials (n = 6,803) found that in-hospital nutritional support led to lower costs and improved outcomes. Over six months, nutritional support reduced hospital-acquired infections, readmissions, and length of stay, resulting in per-patient cost savings of $2,818. The cost to prevent a hospital-acquired infection was $820, and a non-elective readmission was $733. Additionally, nutritional support improved survival, with 2.53 extra lifedays gained per patient and an incremental cost per lifeday of -$1,149, confirming its cost-effectiveness in hospitalised patients at nutritional risk.119
- A meta-analysis of 5 studies in abdominal surgical patients (n = 368) showed a mean cost saving of £746 or 13.5% with ONS versus standard care. This is based on 2003 prices. Following adjustment for inflation, using specific healthcare inflation rates, the savings in 2015 could be as high as £1,014 (or €1,415) (see Figure 3.29).1 ⁱⁱ
- A retrospective cost analysis was undertaken by Stratton et al. (2003) of 9 RCTs (with and without use of ONS). This simple analysis demonstrated mean cost savings of between €396ⁱⁱⁱ (£352) and €9,197ⁱⁱⁱ (£8,179) per patient in surgical, orthopaedic, elderly and cerebrovascular accident patients.2
- Several studies highlighted the effectiveness and economic advantages of ONS in various settings, which is consistently supported across multiple systematic reviews and economic analyses. A 2023 systematic review and meta-analysis show that ONS use in hospital and community settings, and across diverse age groups significantly improves clinical outcomes and reduces incidence of complications, such as infections, pressure ulcers, post operative complications, poor wound and fracture healing.55
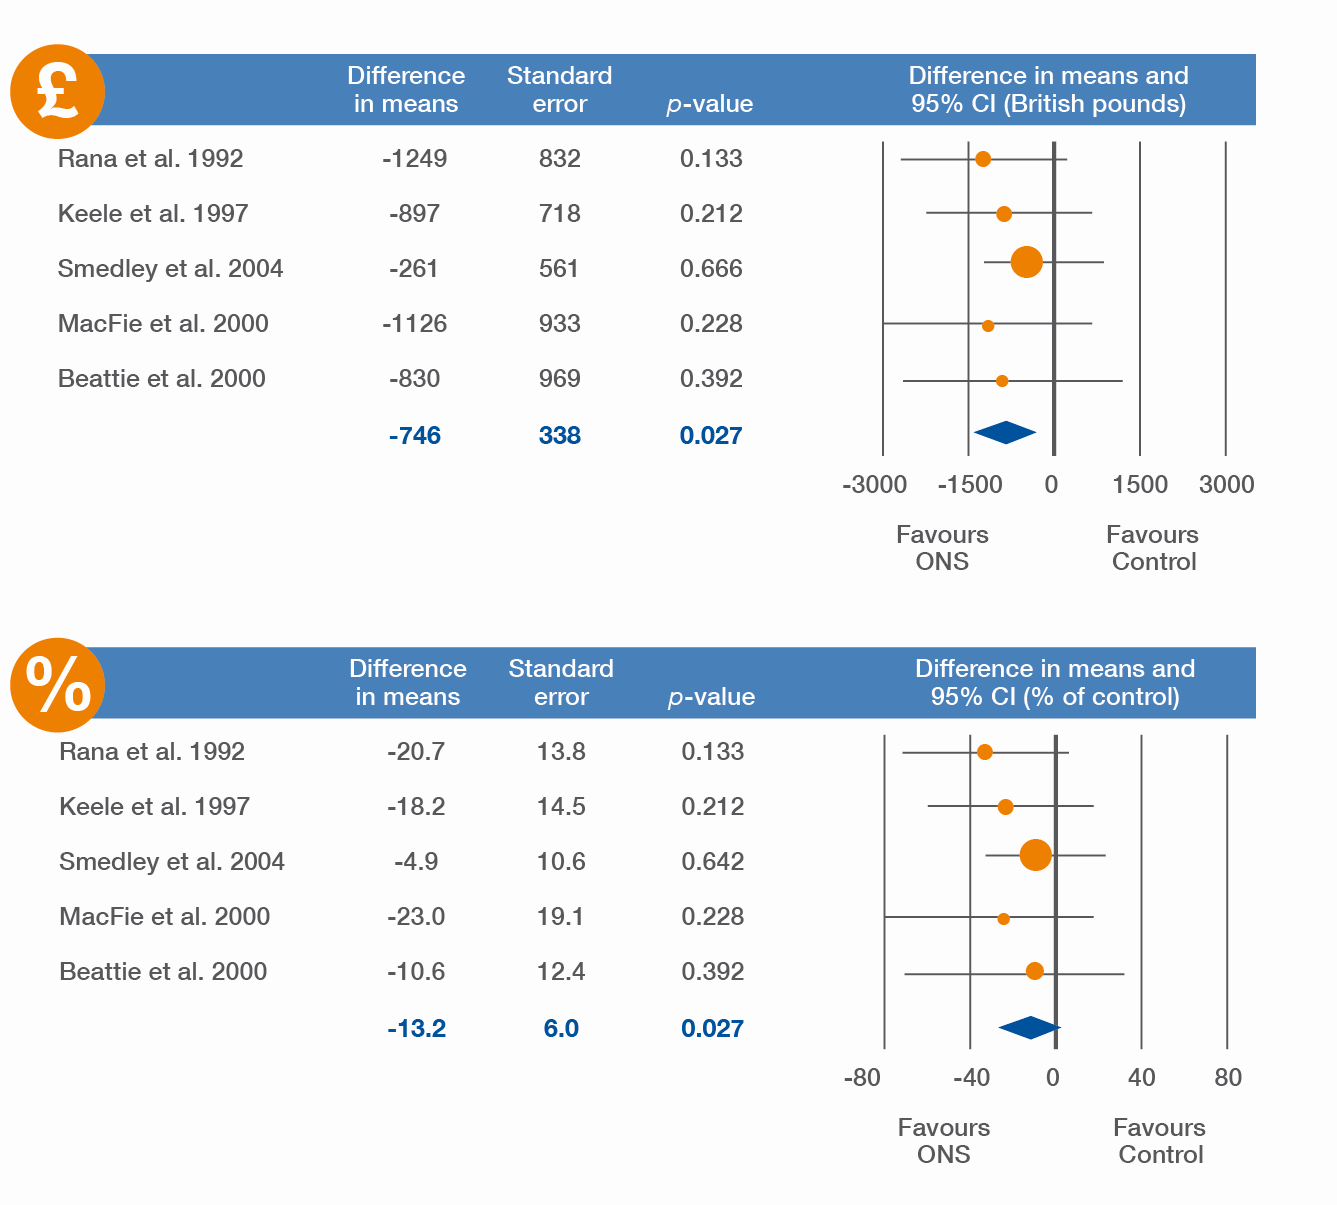
Meta-analysis (with inverse variance weighting) of net cost saving of five randomised controlled trials of abdominal surgery in the UK (n = 358). (Adapted from Elia et al. 2016) 1
Upper graph results are presented in GBP (£) (2003 prices) (mean cost saving £746/patient [se £338], p = 0.027; I2 = 0%) Lower graph results presented as percent reduction of control group (mean cost saving 13.2% [se 6.0%], p = 0.027; I2 = 0%). Negative signs indicate cost saving * based on retrospective data analysis as provided in the BAPEN report.ⁱⁱGBP (£) (2003 prices) se £346, p = 0.026; I2 = 0%. **se 6.1%, p = 0.026; I2 = 0%. Calculated based on Hospital and Community Health Services (HCHS) pay and prices inflation figures 2013-2014. Calculation for 2015 based on 2013-2014 figures. ⁱⁱⁱCalculated based on an exchange rate of 1 GBP = 1.1245 EUR (Source: Interbank 12/07/2017)
 Use of ONS for <3 months in patients in the community leads to cost saving of 9.2%
- Elia et al. undertook a comprehensive review of the cost and cost-effectiveness of using standard ONS in community and care homes. To provide an overview of studies undertaken in different countries at different times using different currencies, the results were presented as percentage cost savings. Overall, there was a significant cost saving (median 8.1%) in favour of the ONS group. When used for <3months the mean cost saving was 9.2% and when used for ≥3months there was a median cost saving of 5%. Abstracts were not included in the analysis above, but all favoured the ONS group (see Table 3.3).113
- An economic assessment of a randomised controlled trial evaluated the cost-effectiveness of a solid ONS in cookie form for malnourished older adults. Over 18 weeks, consuming 6 weeks of ONS cookies resulted in cost savings for health insurance, primarily from reduced hospital stays and medical consultations for falls (€168.81) and infections (€58.90). Daily savings ranged from €1.52 to €2.48 per resident, and nursing staff workload decreased by 30 minutes per resident daily. The cost of the ONS was offset by improved nutritional status, supporting its cost-effectiveness in elderly care.123
Retrospective cost-analyses of community studies comparing ONS with control groups (adapted from Elia et al.)113
| Studyb | N | Setting | Cost saving per subject in favour of ONS groupc | Cost saving (% of control)c | Nutritional Status | Age group (years) | Type of study | Single-or multi-centre | Comparison | ONS use (months) |
|---|---|---|---|---|---|---|---|---|---|---|
| Smedley et al. 2004 | 85 | C(pre-op) | £440.6 b | 9.2 | M+NM | <65 | I | Multi | ONS v no ONS | <3 |
| MacFie et al. 2000 | 49 | C(pre-op) | £330.1 b | 7.3 | M+NM | ≥65 d | I | Single | ONS v no ONS | <3 |
| Flynn et al. 1987 | 36 | C(pre-op) | £1113.1 b | 13.7 | M | <65 | I | Single | ONS v no ONS | <3 |
| Smedley et al. 2004 | 76 | C(pre-op)H | £853.2 b | 16.2 | M+NM | <65 | I | Multi | ONS v no ONS | <3 |
| MacFie et al. 2000 | 49 | C(pre-op)H | £704.8 b | 14.4 | M+NM | <65 d | I | Single | ONS v no ONS | <3 |
| Freijer & Nuijten 2010 | Model | C(pre-op)H | €252.0 b | 7.6 | M | <65 | IO | Multi | ONS v no ONS | <3 |
| Smedley et al. 2004 | 76 | C(pre-op)HC (post op) | £788.5 b | 14.9 | M+NM | <65 | I | Multi | ONS v no ONS | <3 |
| Beattie et al. 2000 | 101 | HC(post-op) | £668.2 b | 8.5 | M | <65 | I | Single | Other f | <3 |
| Smedley et al. 2000 | 79 | HC(post-op) | £260.7 b | 4.9 | M+NM | <65 | I | Multi | ONS v no ONS | <3 |
| Neelemaat et al. 2012 | 184 | HC(post- | -€403.0 | -4.9 | M | ≥65 | I | Single | Other | ≥3 |
| discharge) | ||||||||||
| Edington et al. 2004 | 100 | C | -£1159.34 b | -54.0 | M | ≥65 | I | Multi | Other | ≥3 |
| Arnaud-Battandier et al. 1999 | 378 | C | €195.0 | 7.2 | M | ≥65 | O | Multi | Other | ≥3 |
| Nuijten & Mittendorf 2012 | Model | C | €245.5 | 14.1 | M | <65 e | I | Multi | ONS v no ONS | ≥3 |
| Freijer et al. 2012 | Model | C | €90.1 | 4.7 | M | ≥65 | I | Multi | ONS v no ONS | ≥3 |
| Hirsch et al. 1993 | 51 | C | -(loss) b | loss | M+NM | <65 | I | Single | ONS v no ONS | ≥3 |
| Wilson et al. 2001 | 32 | C | +(saving) b | saving | M | <65 | I | Multi | Other | ≥3 |
H = Hospital; C = Community; pre-op = pre-operative; post-op = post-operative. The sequence indicates the order in which ONS was administered (e.g., HC = hospital first and then community); M = malnourished; NM = non-malnourished; I = interventional; O = observational. ᵃOnly full text papers and analyses of full text papers in reports are included. ᵇDetails of the retrospective economic analyses can be found in the BAPEN report. ᶜPositive values indicate that the net balance favours the ONS group (lower cost in the ONS group than the comparison group) and the negative sign, the comparison group (higher cost in the ONS group than the comparison group). ᵈBased on average of the mean age of the groups involved. ᵉLargely based on Norman et al. 200831. ᶠONS v routine care (which may include use of some ONS).
- In the same review by Elia et al. (2016) examination of the RCTs that pre-planned to undertake cost analysis showed that ONS administration for between about 2 weeks and 3 months contributed to only 1-11% of the total treatment cost (mean of less than 5%) while hospitalisation contributed to 69 to >90% of costs.113
- A budget impact model was used to investigate the impact of using ONS to manage older people in the community in England at high risk of malnutrition (‘MUST’). Pooled analysis of data showed reductions in pressure ulcers, infections, antibiotic prescriptions and hospital admissions (by 88%, 32%, 56% and 33% respectively) with oral nutritional intervention using ready-made ONS versus controls. The resulting reduction in costs (-€99 millionⁱᵛ [-£88 million]) more than offset the total costs of using ONS in conjunction with monitoring by healthcare professionals (€94ⁱᵛ [£84 million]). Overall, the budget impact showed annual cost savings of €18 millionⁱᵛ (£16 million) when using ONS to manage DRM in eligible older people in England.124
- A 2020 budget impact analysis conducted in the US assessed the 30-day cost saving of a nutrition-focused quality improvement program for post-acute care patients at risk of poor nutrition. Comparing 1546 program participants to a historical cohort of 7413 patients, the analysis included hospitalisations, emergency visits, outpatient visits, and associated costs. Results showed a total cost savings of $2.41 million and a net savings of $1558 per patient. These findings underscore the value of implementing nutrition-focused programs to reduce healthcare burden and improve patient outcomes (Table 3.4).125
Cost-Savings During the 30-Day Period After a Quality Improvement Program (adapted from Sulo et al.)125
| Quality improvement program (N = 1546) | Costs, $ |
|---|---|
| Total HCRU costsᵃ | 5,999,897 |
| Total resource costsᵇ | 402,794 |
| Per-patient resource cost | 261 |
| Total cost per 1000 patients | 4,141,000 |
| Total per-patient cost | 4141 |
| Historical controls (N = 7413) | Costs, $ |
| Total HCRU costsᶜ | 42,249,879 |
| Total quality improvement program resource costs | 0 |
| Per-patient quality improvement program resource cost | 0 |
| Historical total cost per 1000 patients | 5,699,000 |
| Comparison total per-patient cost | 5699 |
| Comparison | Cost-savings, $ |
| Overall, per quality improvement program patient population (N = 1546) | 2,408,668 |
| Overall, per 1000 patients | 1,558,000 |
| Per-patient net-savings | 1558 |
Costs are reported in 2017 US dollars; some numbers are rounded to the nearest decimal.
ᵃCosts incurred from hospitalisations ($3,677,140), emergency department ($162,264), and outpatient visits ($2,160,490) for the program total cohort.
ᵇCosts of quality improvement program implementation, including patient screening and assessment (n = 5688 screened; $67,043) and patient education, follow-ups, and other program requirements (n = 1546; $164,470), and oral nutritional supplement bottles and delivery (n = 1546 enrolled in the program; $171,281).
ᶜCosts incurred from hospitalisations ($29,838,296), emergency department ($583,538), and outpatient visits ($11,828,045) for historical (pre–quality improvement program) cohort (n = 7413).
HCRU indicates healthcare resource utilisation.
ⁱᵛCalculated based on an exchange rate of 1 GBP = 1.1245 EUR (Source: Interbank 12/07/2017)
- A systematic review and meta-analysis of RCTs investigated the effect of high-protein ONS versus control (routine care, placebo) on length of stay, readmissions and costs (hospital and community). Meta-analysis of 9 RCTs showed an associated reduction in bed-day costs corresponding to €1,580ⁱᵛ (£1,405) per patient enrolled in the study resulting from significantly reduced length of stay compared to controls. Meta-analysis of 2 RCTs showed significant cost savings of €363ⁱᵛ (£323) (95%; CI €124–€599ⁱᵛ [£110–£533], p = 0.003) per patient enrolled associated with significant reductions in readmissions in favour of ONS.126
- The Oligo Element Sore Trial demonstrated, across the 7 cites in Italy, that a disease-specific nutritional formula enriched with arginine, zinc, and antioxidants improves pressure ulcer healing in malnourished patients compared to standard isocaloric–isonitrogenous support. Despite higher supplement costs (+€39.4, p < 0.001), its use led to overall cost savings in pressure ulcer care, reducing non-nutritional pressure ulcer care costs by €113.7 (p = 0.001) and local pressure ulcer care costs by €74.3 (p = 0.013). Cost-effectiveness analysis confirmed its value, reinforcing that targeted nutritional support enhances healing while reducing healthcare costs.127
- Nutritional support in adults is listed in the top 6 of the NICE cost-saving guidance, with estimates suggesting that improving screening, assessment and treatment of malnourished patients could lead to cost savings of €80,740ⁱᵛ (£71,800) per 100,000 population). Among NICE clinical guidelines/quality standards, it ranks third highest in terms of cost savings.ᵛ
- The economic budget impact analyses from a report from the Malnutrition Action Group of BAPEN and the National Institute for Health Research Southampton Biomedical Research Centre indicate that the use of nutritional support including ONS, EFT and PN ultimately save rather than cost money (€134,000 – €486,000ⁱᵛ [£119,000 – £432,000] per 100,000) depending on the model used. It is necessary to make a commitment to invest money before the financial benefits can be reaped (see Figure 3.30).128
- A comprehensive analysis by Elia et al. demonstrated that implementing NICE nutritional guidelines in England yielded net savings of £123,530 per 100,000 population, amounting to an estimated £65 million in total savings.129
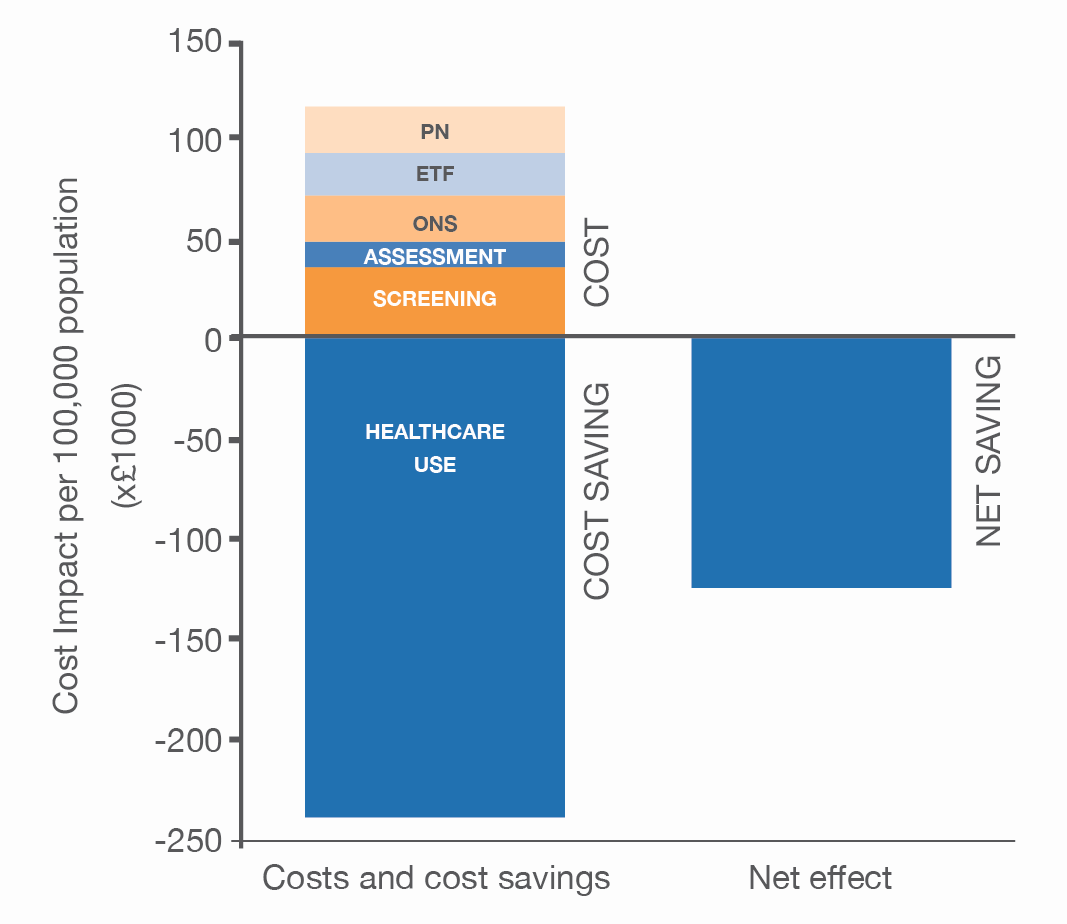
The costs, cost savings and budget impact(net effect) of providing nutritional support to -85% of subjects with high risk of nutrition (model 5). (Adapted from Elia, M. 2015) 128
PN = parenteral nutrition, ETF = enteral tube feeding, ONS = oral nutritional supplements.
ⁱᵛCalculated based on an exchange rate of 1 GBP = 1.1245 EUR (Source: Interbank 12/07/2017) ᵛSource: http://www.bapen.org.uk/resources-and-education/publications-and-reports/malnutrition/cost-of-malnutrition-in-england (Accessed 13.07.17) ᵛⁱQALY is an index of survival that is adjusted to account for the patient’s quality of life. QALYs have the advantage of incorporating changes in both quantity (longevity/mortality) and quality (morbidity, psychological, functional, social and other factors) of life. QALYs are used to measure benefits in cost-utility analysis ᵛⁱⁱCalculated based on an exchange rate of 1 USD = 0.8712 EUR (Source: Interbank 12/07/2017).
- Treatment group patients gained 0.011 more QALYsᵛⁱ than control group subjects in an economic evaluation carried out alongside a multi-centre, randomised, controlled clinical trial comparing a high-protein ONS (containing beta-hydroxy-beta-methylbutyrate) with placebo in a cohort of malnourished older adults (n = 652).130
- An economic evaluation carried out alongside a multi-centre, randomised, controlled clinical trial comparing a high-protein ONS (containing beta-hydroxy-beta-methylbutyrate) with placebo in a cohort of malnourished older adults (n = 652) showed that the cost effectiveness of the intervention based on the first 90 days’ post-discharge was €22,413ᵛⁱⁱ US$25,727 per QALY (€25,682ᵛⁱⁱ US$29,479 per life-year). The incremental cost-effectiveness ratio (ICER) over the 90-day follow-up period was €29,462ᵛⁱⁱ US$33,818/QALY and when the time horizon was extended to patients’ entire lifetime, the intervention cost was €457ᵛⁱⁱ US$524 per life-year saved.130
- A large-scale analysis of 27,152 hospitalised adults in China showed that ONS use was associated with a higher effective rate (51.7% vs. 50.3%, p < 0.05) despite greater disease severity at baseline. Cost-effectiveness modelling demonstrated that ONS led to an incremental cost of 19,851 yuan with an additional 1.3406 effectiveness rate, resulting in an ICER of 14,807 yuan—well below China’s 2020 per capita GDP threshold (71,965 yuan). Sensitivity analyses confirmed these findings, reinforcing the cost-effectiveness of ONS in hospitalised patients at nutritional risk and supporting its broader reimbursement coverage.131
- Malnutrition in hospitalised patients is often overlooked, leading to higher infection rates, longer hospital stays, increased mortality, and greater healthcare costs. Implementing early nutrition therapy, including oral supplements, in Brazilian public hospitals proved to be cost-effective, with savings of $92.24 per avoided hospital day, $544.59 per additional patient treated, $1,848.12 per prevented readmission, and $3,698.92 per prevented death. The greatest cost savings came from reducing hospital stay duration, highlighting the need for educational programs to improve inpatient nutritional care.132
- A review of 9 studies found that most nutrition interventions were both more costly and more effective than standard care.133
The cost-effectiveness plane
Figure 3.31 depicts a cost-effectiveness plane. The origin is the standard of care, the y-axis represents the costs, and the x-axis represents the effects.
- All values in the north-west quadrant depict more costly but also less effective interventions. These interventions are not considered cost-effective, and based on these grounds they will be rejected by decision-makers.
- All interventions in the south-east quadrant depict less costly but also more effective interventions. These will therefore be considered cost-effective and should be adopted by decision-makers.
- The results in the north-east quadrant are more costly but also more effective. The decision made about results in this section is related thresholds that reflect the decision-makers’ willingness to pay for incremental benefits and the comparative advantages over the standard of care.
- The results in the south-west quadrant represent less costly and also less effective choices. Most authorities do not consider interventions that are less effective than the standard of care. However, if the standard of care weighs very heavily on healthcare budgets, interventions in the south-west quadrant will be considered for subgroups with mild disease severity.
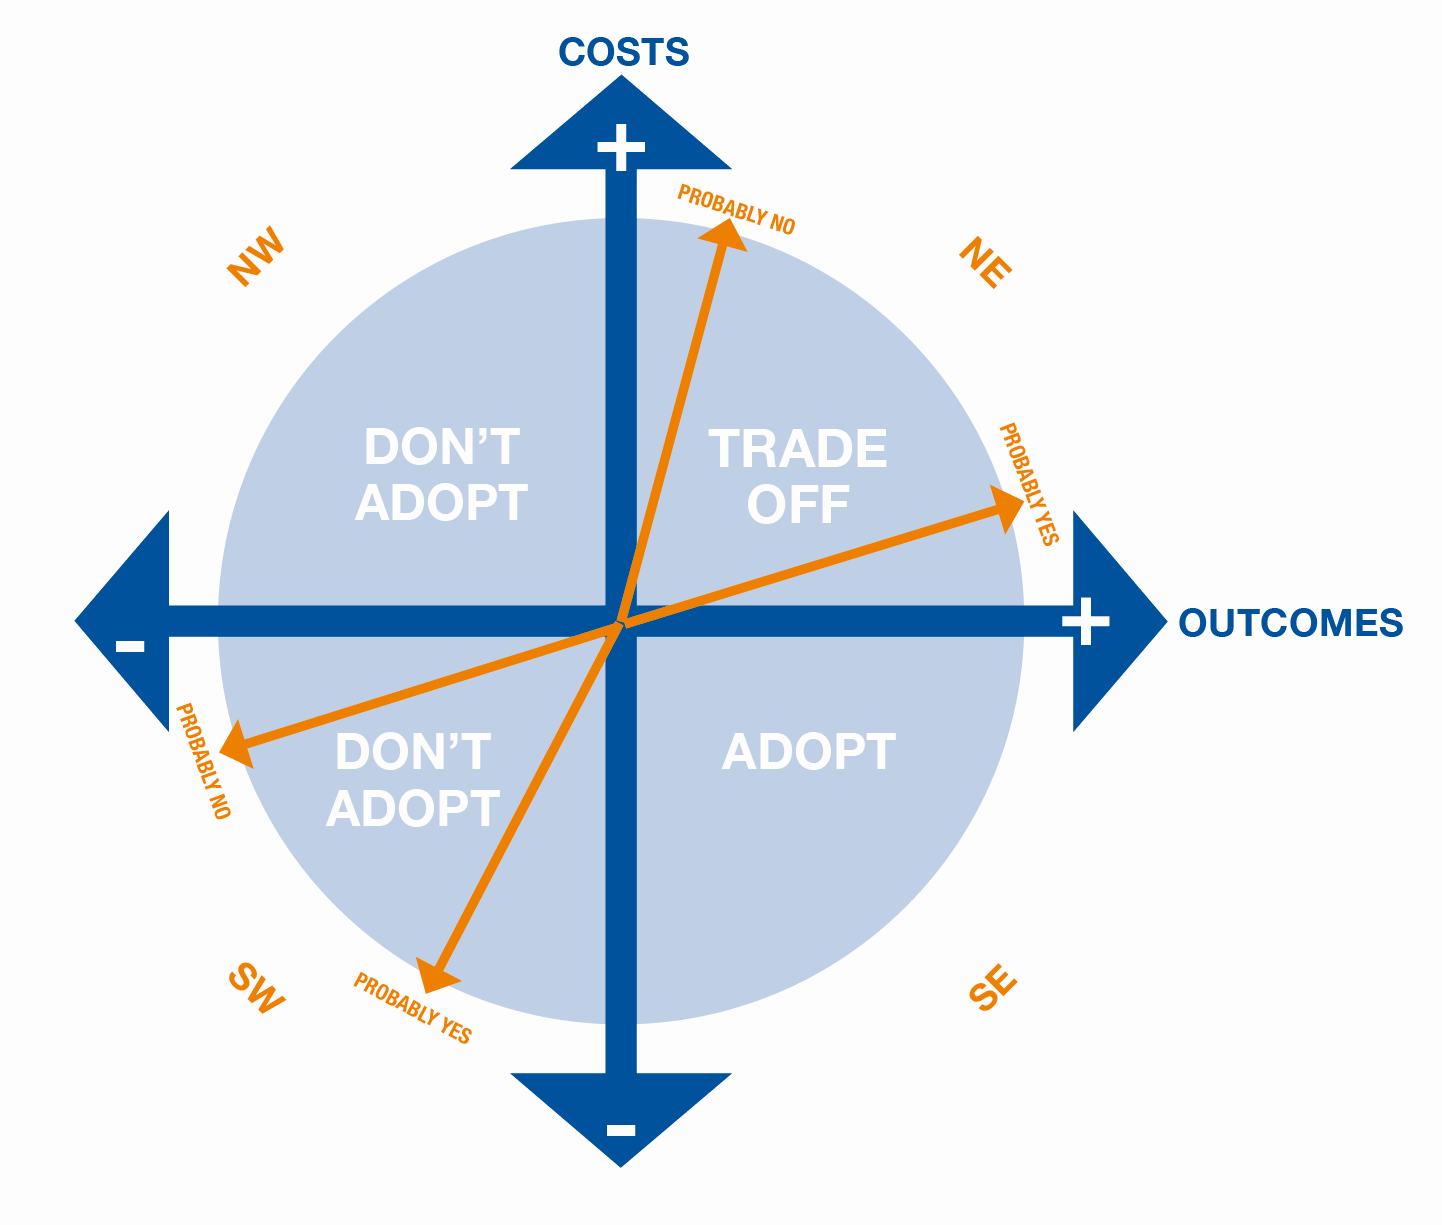
The cost-effectiveness plane
- Many of the studies discussed earlier in this section show that oral nutritional intervention with ONS leads to cost savings. Therefore, these results always depict the south quadrants. The studies discussed in Section 3.1.3 Clinical Benefits of ONS show that most studies place the use of ONS in the east quadrants. As explained above, interventions in the south-east quadrant should be adopted because they are more effective and less costly. Those in the north-east quadrant may be cost-effective depending on the ceiling ratios or thresholds considered by decision-makers (willingness to pay for added value to the healthcare system) (see Figure 3.32).
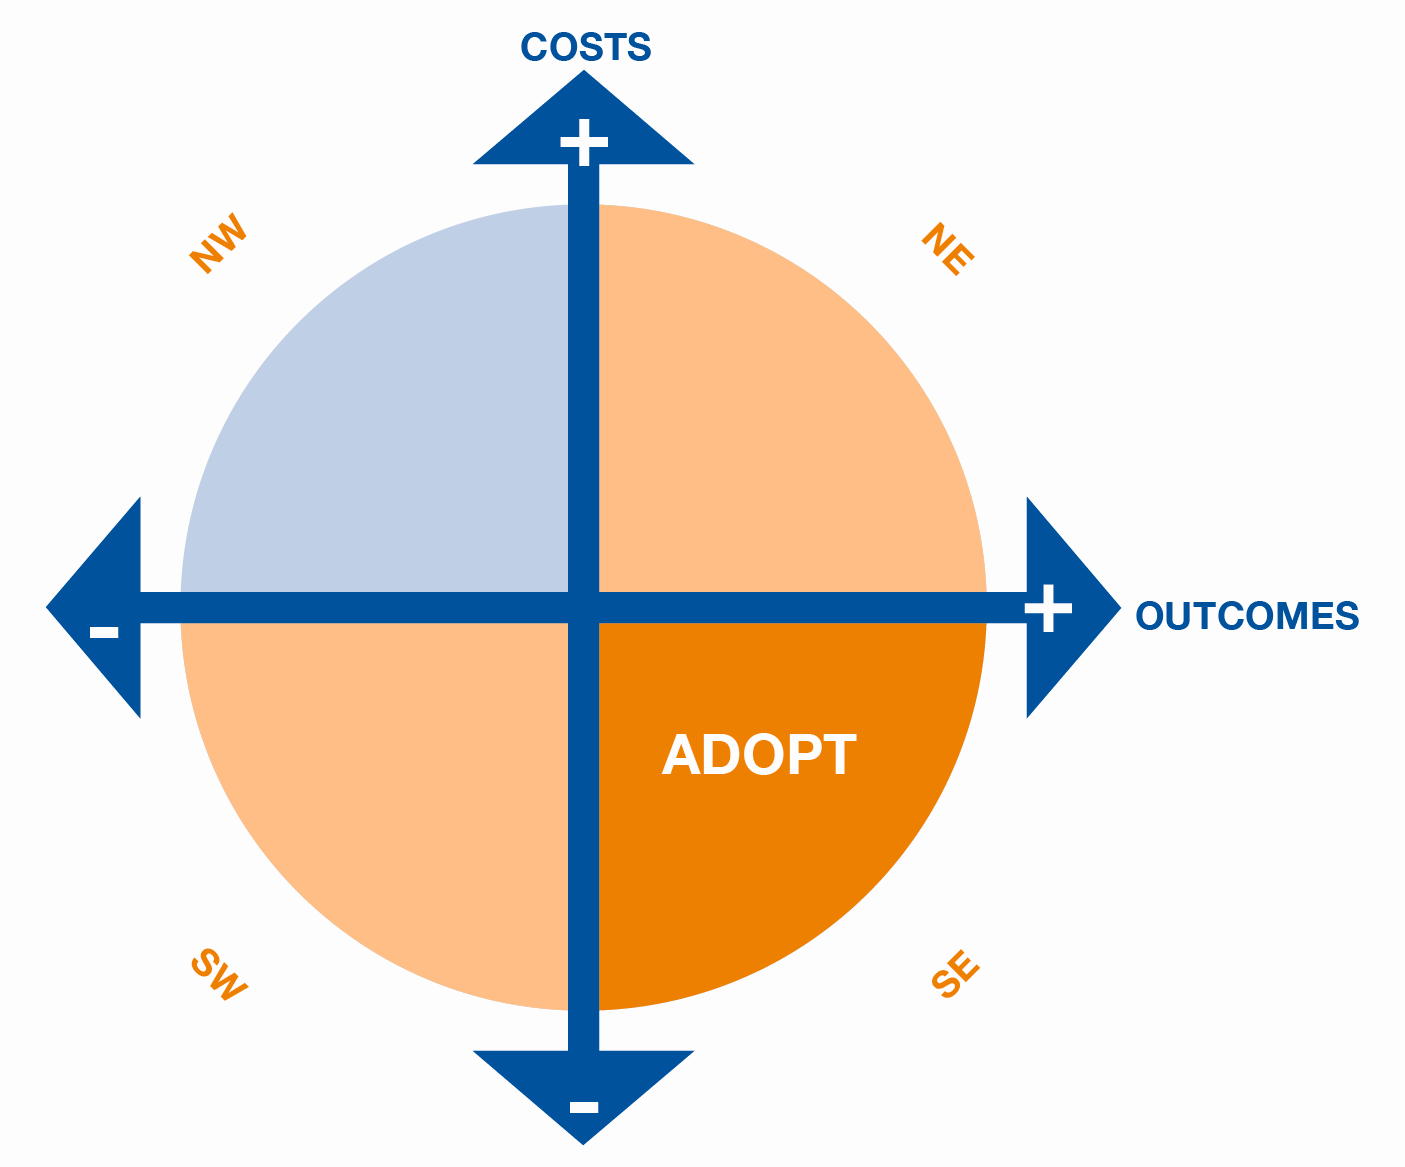
Based on clinical trials, oral nutritional supplementation has clinical benefits, placing the use of ONS in the east quadrants. Studies which have demonstrated cost savings place the use of ONS in the south quadrants.
 Cost savings and cost-effectiveness of ONS in children
- To date, there have been few health economic analyses of the economic benefit of oral nutritional intervention with ONS in children. In the absence of this data, it is worth keeping in mind that ONS has been shown to generate significant cost savings on a per patient and per population basis in adults and that ONS have been shown to be cost-effective.
- A retrospective analysis conducted in 2014 of 557,348 hospitalisations of children aged 2–8 years in the Premier Research Database in the US examined the use of ONS on LOS and episode cost in a propensity score-matched sample (analyses with and without the use of instrumental variables (IVs) to reduce confounding from unobserved variables). ONS were prescribed in 6066 of 557,348 inpatient episodes (1.09%). In IV analysis, using a matched sample of 11,031 episodes, hospitalisations with ONS use had 14.8% shorter LOS (6.4 vs 7.5 days; 1.1 days [95% CI, 0.2–2.4]) and 9.7% lower cost (€14,420 vs €15,960; €1540 {95% CI,€1676 – €1404])ᵛⁱⁱⁱ ($16,552 vs $18,320; $1768 [95% CI, $1924 – $1612]).134
- A study conducted in 2024 assessed the economic impact of paediatric ONS for children at risk for undernutrition in 12 lower-middle-income countries (LMICs) in Asia. The model compared the costs and benefits of administering paediatric ONS with nutritional counselling to standard care, which only included counselling. Results showed that ONS increased height-for-age Z scores (HAZ) by 0.125 units, translating to a $926 increase in lifetime earnings per person and 0.32 additional quality-adjusted life years (QALYs), valued at $1,320. The upfront intervention cost was $210 per person, totalling $19 billion across the LMICs. The total net incremental value of ONS was $2,036 per person, or $182 billion across the 12 countries. The intervention produced an 8.29% annualised rate of return, highlighting the cost-effectiveness of paediatric ONS in improving both economic and health outcome.135
ᵛⁱⁱⁱCalculated based on an exchange rate of 1 USD = 0.8712 EUR (Source: Interbank 12/07/2017)
Cost-effectiveness of ONS among older individuals across settings
- In a systematic review and meta-analysis, assessing both effectiveness and cost-effectiveness of ONS among frail, older individuals who are malnourished or at risk of malnutrition, one study assessed the cost-effectiveness of oral ONS in a care home setting and found that ONS provided greater quality-adjusted life years (QALYs) but at a higher cost compared to dietary advice. The incremental cost-effectiveness ratio was £10,941 per QALY, indicating that ONS are likely cost-effective. Additionally, the probability of ONS being cost-effective at this threshold was 83.69
- Administering a high-protein ONS with beta-hydroxy-beta-methylbutyrate (HP-HMB) to hospitalised older adults has been shown to improve survival compared to a placebo, as demonstrated in the NOURISH study. This cost-effectiveness analysis, conducted from the perspective of the Spanish National Health System, assessed HP-HMB’s value over multiple time horizons. The incremental cost of HP-HMB was €332.75 per patient, with an initial incremental cost-effectiveness ratio (ICER) of €34,700.62 per life-year gained (LYG) at 90 days. However, as the time horizon extended, the ICER significantly decreased—by 60.5% at 180 days (€13,711.68), 90.3% at 1 year (€3,377.96), 93.5% at 2 years (€2,253.32), 96.8% at 5 years (€1,127.34), and 98.4% over a lifetime (€563.84 per LYG). These findings suggest that incorporating HP-HMB supplementation during hospitalisation and post-discharge could be a cost-effective strategy to enhance survival while progressively reducing the marginal cost over time.136
- A cost-effectiveness analysis of a randomised trial in care home residents in England (n=104, mean age 88 years) compared ONS to dietary advice over 12 weeks. ONS led to greater QALY gains but at higher costs, with an incremental cost-effectiveness ratio (ICER) of £10,961–£11,875 per QALY. Sensitivity analysis showed an 83% probability of ICER ≤£20,000 and 92% probability of ICER ≤£30,000, supporting ONS as a cost-effective intervention for improving nutritional status and quality of life in older care home residents.137
- On the contrary, a cost-effectiveness analysis from the NOURISH Study, a multicentre randomised trial, evaluated a specialised ONS in malnourished older hospitalised patients in the USA. Over 90 days, ONS increased survival, leading to 0.011 more QALYs and an incremental cost-effectiveness ratio (ICER) of $33,818/QALY. In a lifetime analysis, ONS extended life expectancy by 0.71 years, with a lifetime ICER of $524/LY, confirming its cost-effectiveness in improving survival at a low cost.130
- In a typical US nursing home, administration of wound-specific -ONS improved healing by 5.7–7.9 weeks, saving $109,269 annually and reducing staff time by 1,040 hours. 138
- Cost savings per patient: $6,319–$16,579 (depending on pressure injury stage);
- Total cost reduction: ~10.9% of annual pressure injury treatment costs;
- Wound specific-ONS is a highly cost-effective strategy for reducing pressure injury-related expenses and workload.
- A 12-week randomised trial in 308 malnourished older adults across seven countries in England, showed that ONS + dietary advice significantly improved nutritional intake (+401 kcal/day, +15 g protein/day, p < 0.001), led to weight gain (+0.8 kg, p < 0.001), and enhanced quality of life (p = 0.009). Compared to dietary advice alone, ONS use was associated with a 34% reduction in healthcare provider visits, 50% fewer emergency admissions, and a 62% shorter hospital stay, highlighting its potential to reduce healthcare burden. With higher patient satisfaction (89% vs. 73%, p = 0.009), these findings reinforce the cost-effectiveness of ONS in improving outcomes while lowering healthcare utilisation in malnourished older adults.3
- Concurrently, a 2022 systematic review and meta-analysis affirm that ONS are both effective and cost-effective for frail older individuals who are malnourished or at risk of malnutrition.69 Additionally, an economic model published in 2023, focused on nursing homes, indicated that wound-specific ONS can considerably reduce the economic burden of pressure injuries (Figure 3.33).138 Further economic evaluations from general hospital settings, illustrate the cost-effectiveness of specialised ONS for malnourished older adults, showing substantial improvements in patient outcomes and reductions in healthcare costs.130,136 These findings are supported by a modelling study in the US, demonstrating that ONS for older adults post-discharge significantly reduces healthcare costs by decreasing the need for medical interventions and readmissions. 139
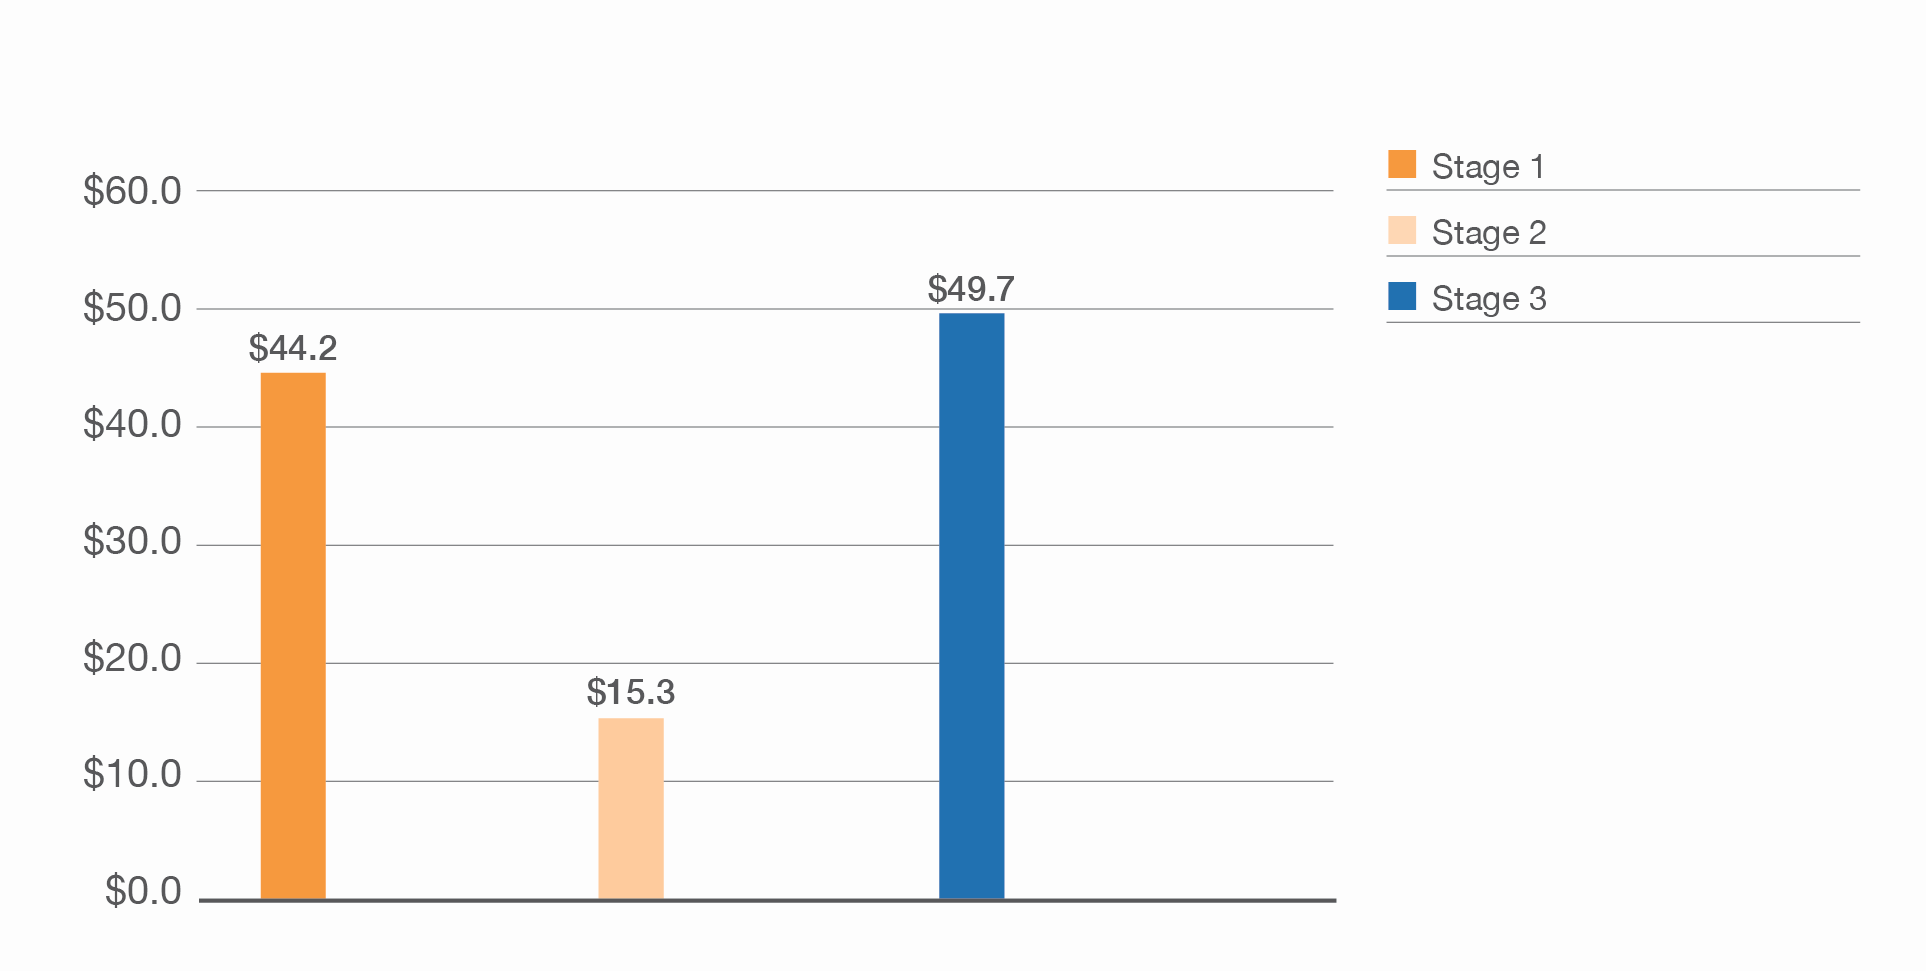
Total Cost Savings from ONS use for the average US nursing home, by Stage (Adapted from Shafrin et al. 2023) 138
¹Total savings are rounded to the nearest dollars