
1.4.3.2 FINANCIAL COSTS
Malnutrition increases healthcare costs
The financial burden of malnutrition is, increasingly, being defined and recognised. Historically much of the data on the costs of malnutrition has arisen from the UK from work undertaken by the British Association of Enteral and Parenteral Nutrition (BAPEN), with the first report on the costs of malnutrition being published in 2005.350 The reports from BAPEN have been used by other workers to help estimate the cost of DRM in their own countries or for Europe as a whole.351-353
Increases in health and social care budgets together with improvements in defining and recording costs have led to an updated version of the report which aims to provide more accurate assessment of the costs of malnutrition.354 The latest report is specific to England rather than the UK as a whole. This is because, as the four devolved nations of the UK (England, Scotland, Wales, and Northern Ireland) have been developing their own distinct healthcare systems using specific budgets allocated to their countries, it has become increasingly difficult to use a common framework to establish the cost of malnutrition in the UK as a whole.
Increasingly, data on the costs of malnutrition is available in other countries. Some of this data has been generated by prospective studies that measure the direct costs of hospital admissions for a malnourished vs. a well-nourished patient. Other estimates are made based on economic models that look at disease prevalence, malnutrition prevalence within disease states and financial data on the cost of treating the disease. However, what is clear from all of these reports and studies is that the financial burden of DRM is significant both at an individual level and at a population level.
The costs of DRM have increased and the cost of treating a malnourished patient is 2-3 times greater than for a non-malnourished patient.
- The public health and social care expenditure associated with malnutrition in adults and children in England in 2011–12, identified using the ‘Malnutrition Universal Screening Tool’ (‘MUST’), was estimated to be £19.6 billion, or about 15% of the total expenditure on health and social care.354
- Previous BAPEN reports have suggested that malnutrition accounted for >10% of the total costs in the UK.350,355 However, according to the latest report the estimated cost of disease-related malnutrition appears to have increased considerably over time:
- >£7.3 billion in the UK in 2003;
- >£13 billion in the UK in 2007;
- £19.6 billion in England in 2011–12;
- £23.5 billion in UK in 2015.
This is thought to be due to a striking increase in the budget for health and social care between 2003 and 2012 and the fact that the previous costs were based on minimum estimates. The latest BAPEN report involves a more complete analysis of all the major services and associated costs providing a better estimate of the costs of disease related malnutrition.354
Total expenditure of £19.6 billion is made up of £15.2 billion expenditure on healthcare costs and £4.4 billion relating to social are costs (Figure 1.31).
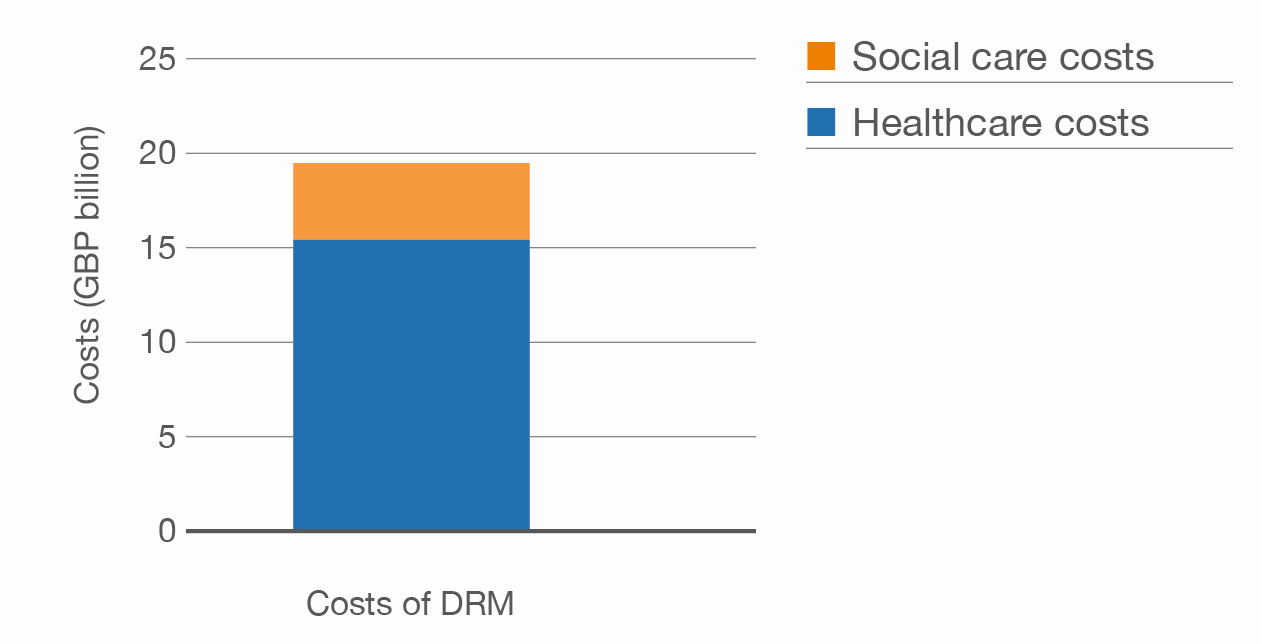
The cost of disease-related malnutrition in England 2011-2012. (adapted from Elia M, 2015)354
- The distribution of expenditure in the malnourished population is broadly similar to that of the general population, although a greater proportion is distributed towards secondary care and to older subjects (≥65 years) in the malnourished population (Figure 1.32)
).
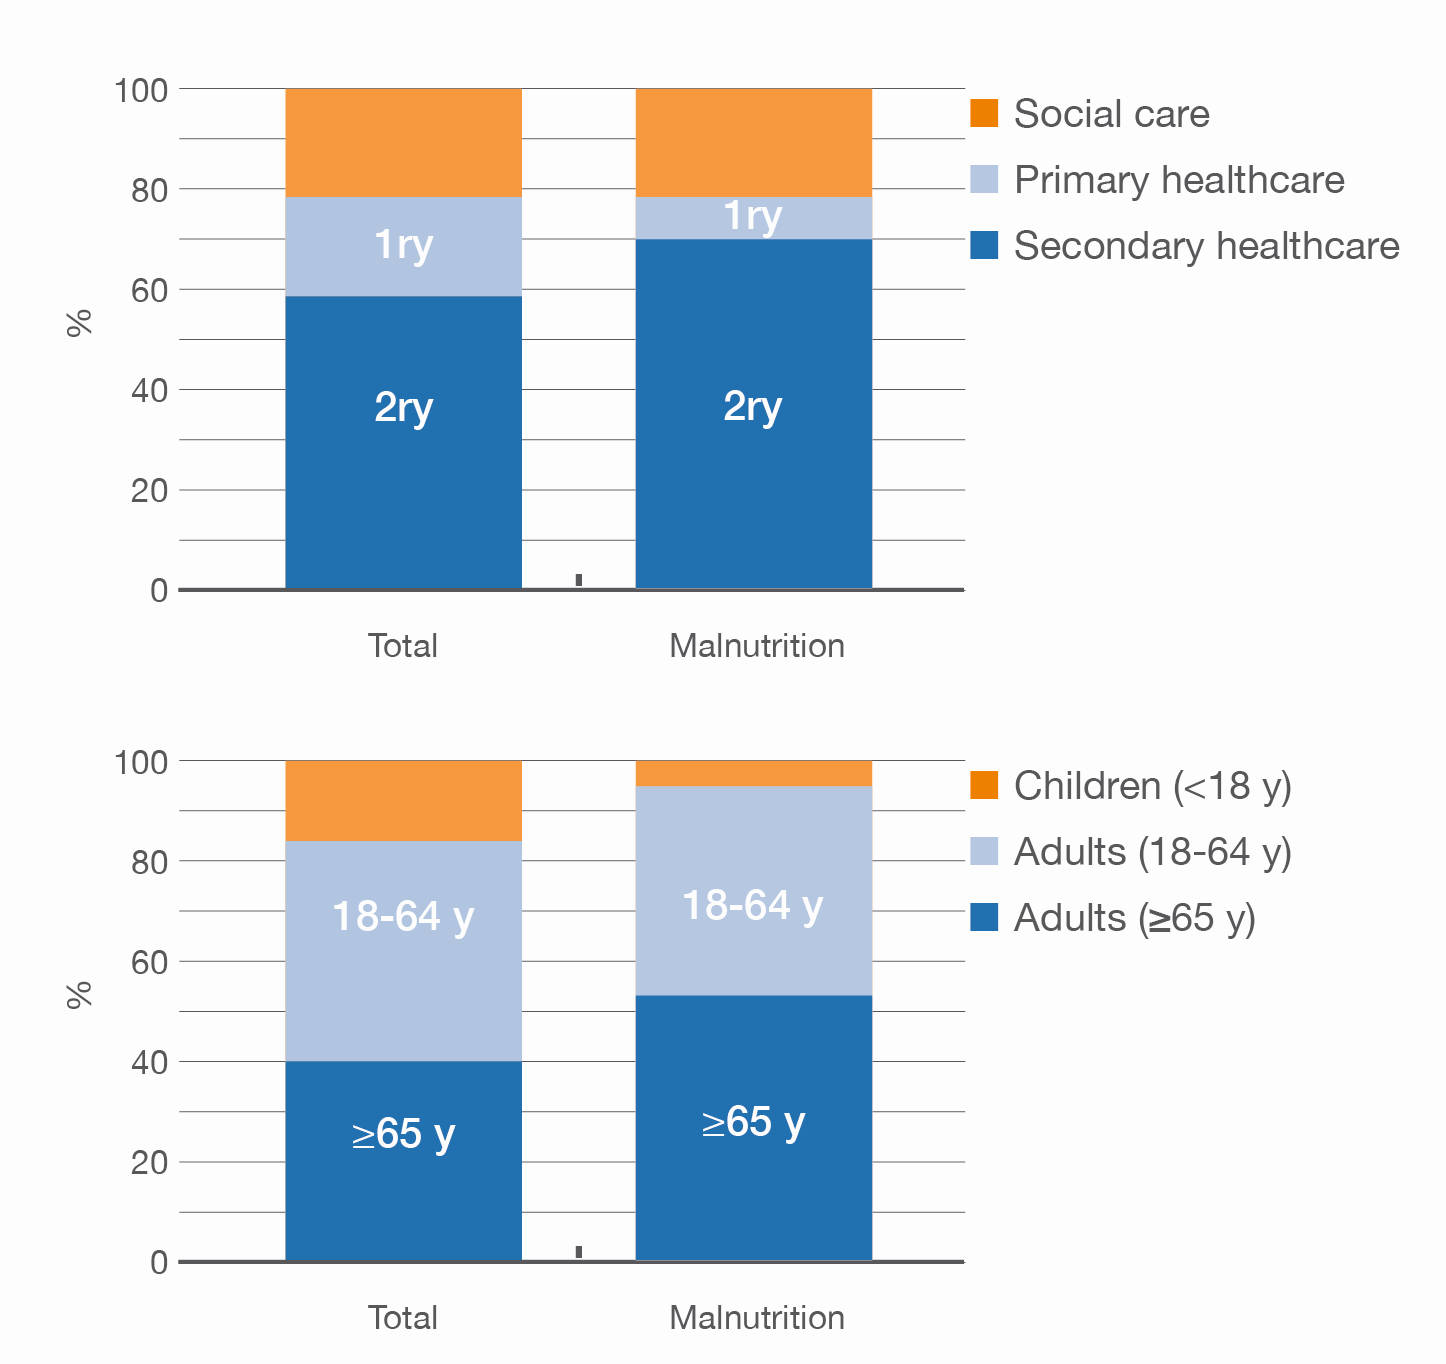
The distribution of total public health and social care expenditure in England (£127.5 billion) and in the subgroup of individuals with malnutrition (£19.6 billion) according to type of care (upper chart) and age category (lower chart) base case analysis. (adapted from Elia M, 2015)354
1ry = primary care; 2ry = secondary care.
- The extra (incremental) cost of treating malnutrition was calculated as being 2–3 times greater than for a non-malnourished subject (Figure 1.33).
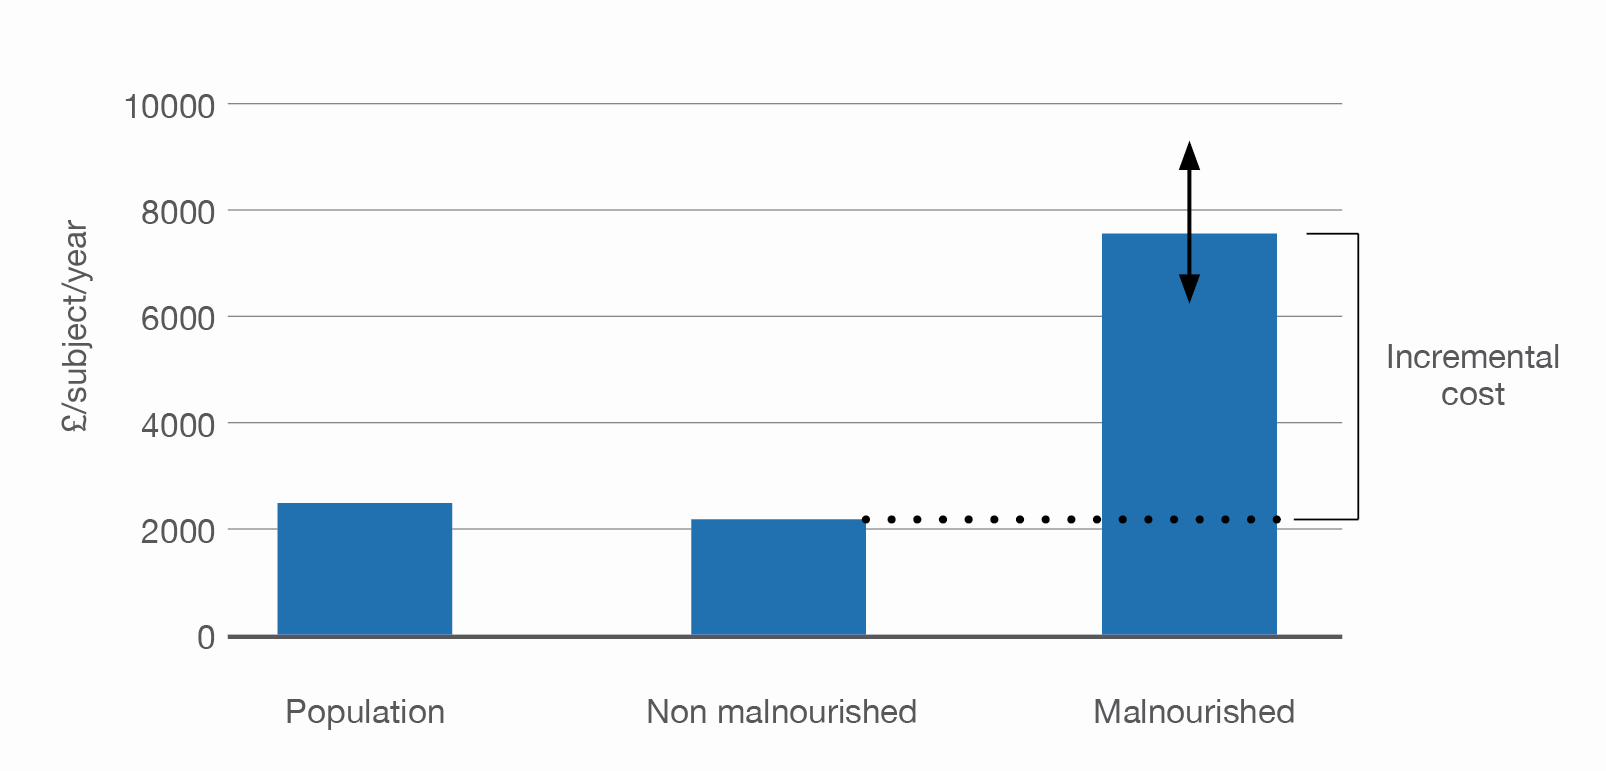
Public expenditure on health and social care per subject in the general population, per subject without malnutrition and per subject with malnutrition (medium + high risk according to ‘MUST’). (adapted from Elia M, 2015). 354
The top of the bars represent the values calculated assuming that 5% of the population is malnourished or at risk of malnutrition. The tip of the upper arrow heads above the bar for the malnourished represents the value calculated assuming that 4% of the population is malnourished and the tip of the lower arrowhead assuming that 6% of the population is malnourished. No arrowheads are shown for the non-malnourished because the base case value was affected by only about ± 1%
- In comparison, estimates of the direct NHS costs of treating overweight and obesity, and related morbidity in England have ranged from £479.3 million in 1998 to £6.5 billion in 2022,354,356,357 significantly lower than the costs associated with DRM.
 Data on the cost of malnutrition in Europe and beyond are now available
Increasingly, more data is now available on the financial burden of malnutrition in many other countries. Estimates for Europe alone suggest that the cost of DRM is €170 billion352 or €120 billion353 in the EU. This estimate is based on health economic evidence from the UK showing that the costs for managing patients at risk of malnutrition exceed €15 billion.355 The recent update by BAPEN puts the figure at £19.6 billion for England alone so it is highly likely that the figures above are now a very conservative estimate of the true cost of malnutrition in Europe.
- In a Spanish study hospitalization costs were calculated, based on a patients’ nutritional status throughout their hospital journey. The highest costs were seen in subjects that were both malnourished on admission and at discharge and hospitalisation costs increased generally for any patient that was malnourished on discharge.335 (Figure 1.34)
- In Italy, DRM is highly prevalent and imposes a significant financial burden on the healthcare system, exceeding €10 billion annually, with even the most conservative estimate exceeding €2.5 billion. Meta-analysis showed DRM prevalence of ~50% in hospitalised adults and ~30% in paediatric patients, with even higher rates in long-term care facilities. 358
- A systematic review assessed the healthcare costs associated with poststroke oropharyngeal dysphagia (OD) and its complications, including malnutrition, dehydration, pneumonia, and mortality. Among 10 included studies conducted across 8 countries (Spain, Germany, France, Italy, Sweden, the United Kingdom, Canada, and the United States), OD was found to increase hospital costs, with studies reporting additional expenses ranging from $3,950 to $15,300 per hospitalization. Patients requiring tube feeding had an increased cost of $6,589, while those with OD incurred additional costs of $4,510 in the first year after stroke. Pneumonia was associated with increased hospitalization costs between $1,456 and $27,633. 359
- In Colombia, the economic burden of malnutrition in hospitalised patients was highlighted by a study showing that, without early nutrition therapy, costs could reach $3,770 for patients with delayed nutrition therapy to $2419 for patients with early nutrition therapy. This represents a significant financial strain on the healthcare system, with potential annual excess costs exceeding $862.6 million. 360
- In Asia, hospital malnutrition imposes an economic burden of $30.1 billion annually, primarily due to increased length of stay (LOS) and higher medication costs. Increased LOS accounts for $23.2 billion (77.2%) in general wards and $3.5 billion (11.5%) in ICUs, while medication costs for infectious complications add $3.4 billion (11.3%). 112
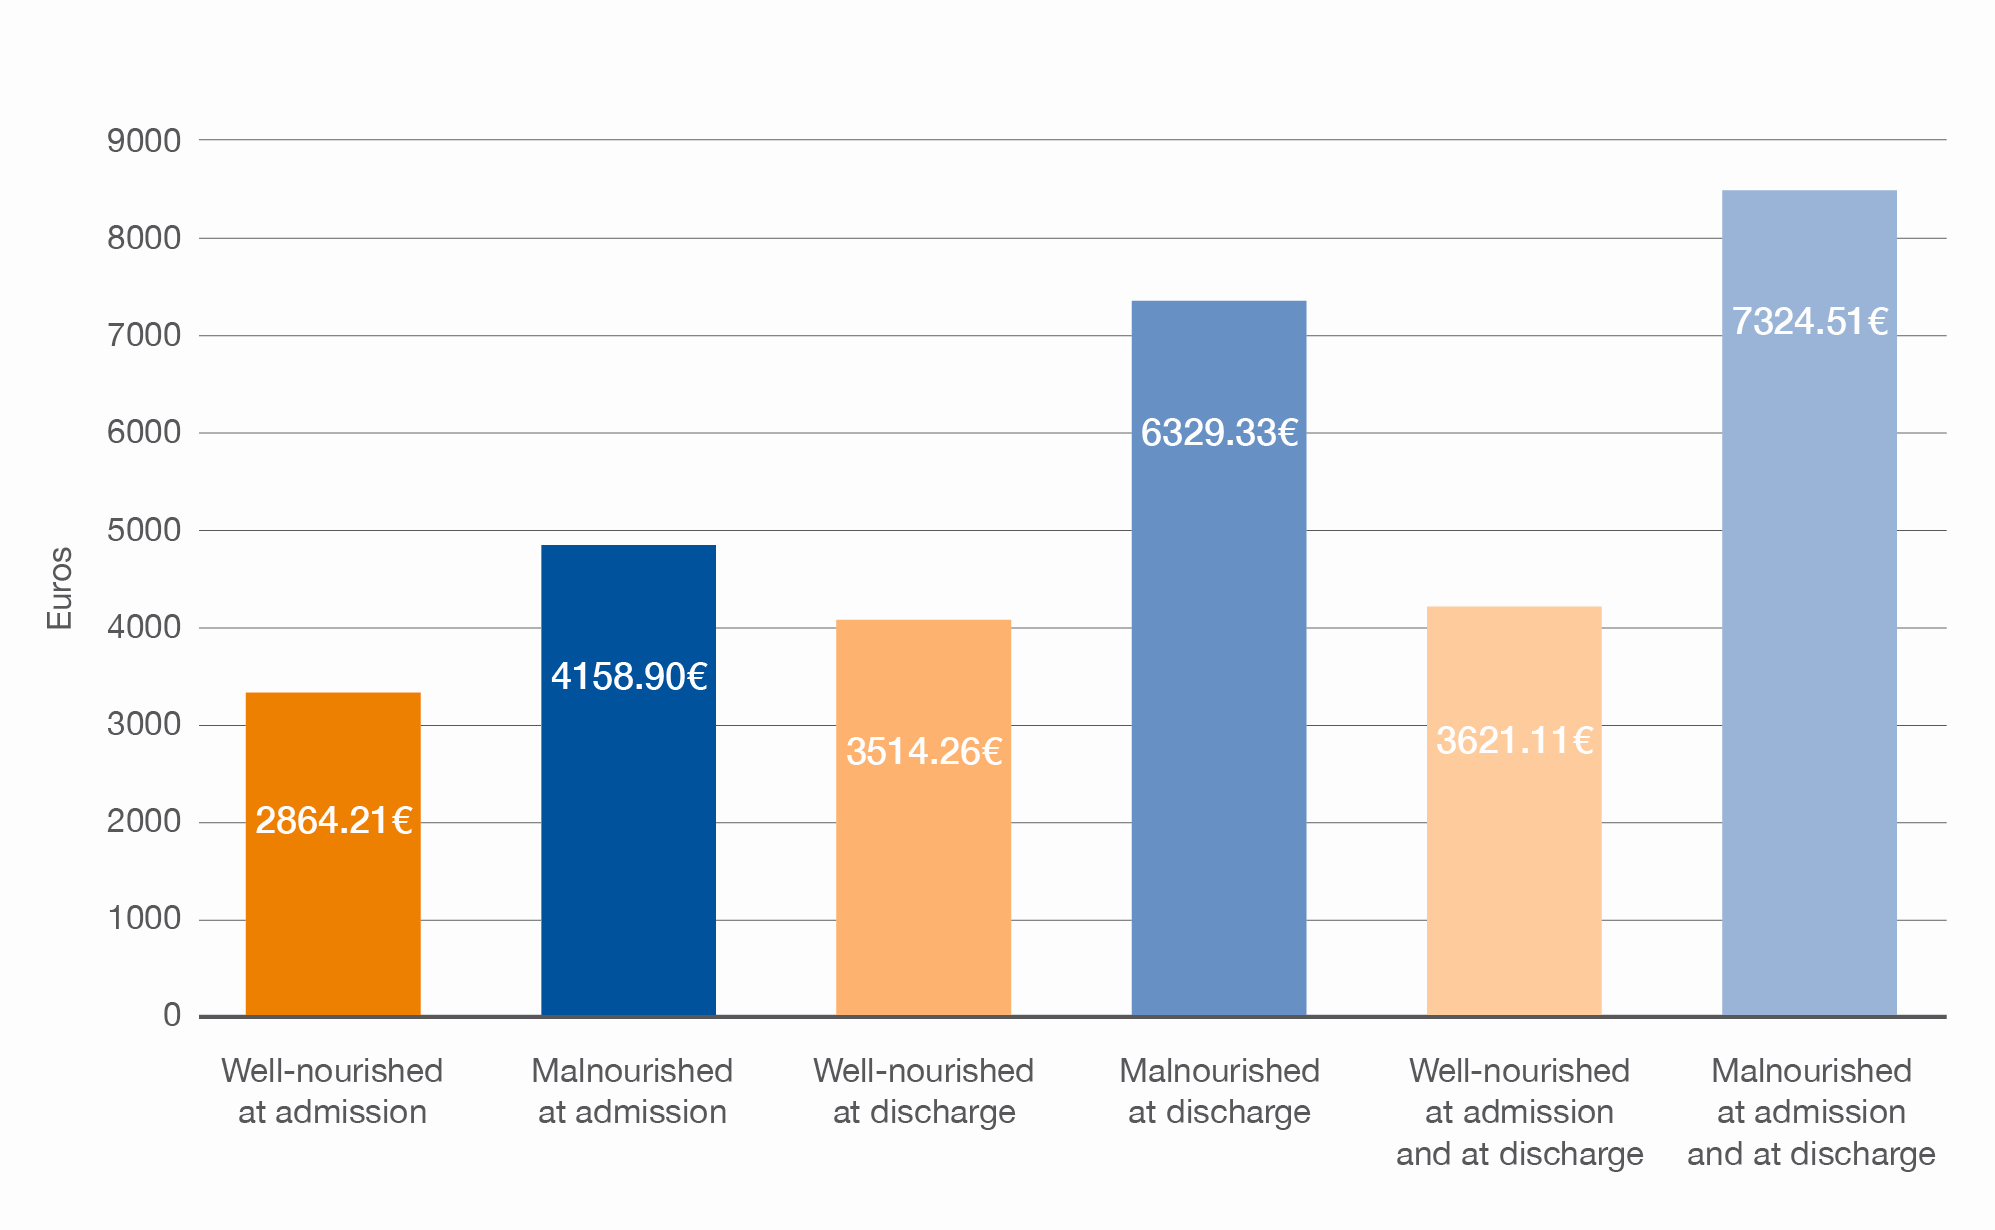
Hospitalisation cost comparisons of subjects according to their nutritional status on admission and/or discharge (adapted from Gastalver-Martin et al. 2015)335
- More recently estimates have been made to quantify the cost of malnutrition in the community with a study based on an economic model in the US estimating the annual cost at $156.7 billion or $508 per US resident,361 whilst a Spanish study estimated that the cost of treating a malnourished patient was over 3.5 times higher than a well-nourished patient 362 in a community setting.
As the volume of evidence on the costs of DRM has increased over recent years, relevant studies have been summarised in Table 1.18 according to the following categories:
- across healthcare settings
- hospital
- community
- children
Data are also now available for the costs of DRM in children
Up until recently, data on the cost implication of malnutrition in children has been lacking. However, a recent report from BAPEN provides financial estimates of the burden of malnutrition in the paediatric population in England: 354
- It is estimated that around 6% of the total public expenditure on malnutrition in health and social care is spent on children in England. This equates to around £1.2 billion 354
- This estimate of the cost of malnutrition in children has been made based on the assumption that malnutrition affects 15% of children admitted to a typical hospital in England and that it prolongs length of hospital stay by 1.3 times, as for adults 354
- malnutrition accounted for 18.7% of costs, when calculated using the same procedures as for adults;
- in relation to outpatients it was assumed that 7.5% of attendances and costs were due to malnutrition
- it was assumed that malnutrition accounted for only 3% of the costs of the children’s social services, including those for looked-after children.
In addition to these estimates, a study using US data from 2010 of hospitalised children showed that:354
- Hospitalisation costs were US$ 55,255 for children with a malnutrition diagnosis vs. US$17,309 without 309
- Hospitalised children with a diagnosis of malnutrition were also less likely to have a routine discharge and almost 3.5 times more likely to require post-discharge home care, suggesting higher costs in the community too.
A cost-of-illness analysis in The Netherlands estimated the annual additional costs of DRM in hospitalised paediatric patients. The total additional medical costs were €51 million for acute malnutrition, €46 million for chronic malnutrition, and €80 million for overall malnourished children, accounting for 5.6% of total Dutch hospital costs for paediatric patients. 363
Studies and reports relating to the costs of disease related malnutrition
| Country | Author (year) Patient group |
Healthcare setting | Study design | Method used to calculate costs | Cost of DRM per patient | Total cost of DRM per annum |
|---|---|---|---|---|---|---|
| Across health care settings | ||||||
| China | Linthicum et al. (2015)225 Covers all ages and genders with a range of diseases with a range of diagnoses >20 years |
Unclear | Economic model | Economic model based on population surveys, current literature and census information quantifies the health burden of DRM (does not include direct medical costs) | NR | US$66 billion ($25.2 billion associated with ≥60 years) |
| Croatia | Benkovic V et al. (2014)228 Adults |
Across healthcare settings | Economic model based on national data | Adapted WHO model that direct costs estimated from disease prevalence and undernutrition incidence based on national disease treatment costs | €1640.48 per person | €97.35 million for the range of diagnoses specified |
| Germany | Cepton Report227 (unclear) Adults |
Across healthcare settings | Economic model | Only direct costs considered | NR | €9 billion (additional costs due to malnutrition in 2003) |
| Ireland | Rice and Normand (2012)217 Adults (age NR) |
Across healthcare settings | Economic model based on national data | Costs based on DRM prevalence and official costs of healthcare utilisation using an adapted BAPEN model | Additional cost of €5357 per patient | €1.4 billion (in 2007) |
| The Netherlands | Kok (2014)228 Adults 20 years |
Hospital, nursing home and residential care | Economic model based on national data | Costs based on DRM prevalence and healthcare costs (as part of a societal cost-benefit analysis) | NR | €1.8 billion (in 2011) made up of: Hospital: €1.1 billion; Residential care and nursing homes: €523 million; Cost of the value of life: €244 million |
| The Netherlands | Freijer et al. (2013)229 Adults >18 years with a range of disease categories |
Across healthcare settings | A cost of illness study using only direct healthcare costs | Formula developed based on disease category costs, prevalence of malnutrition in disease category and increased costs of managing malnourished patients | €135 per head of population of 14 million (per capita in 2011) | €1.9 billion in 2011 made up of: Hospital: €1.2 billion; Nursing and residential homes: €453 million; Home care setting: €185 million |
| Hospital | ||||||
| Australia | Rowell and Jackson (2011)230 Hospital patients >14 years (n = 256,865) |
Hospital | Retrospective analysis | Costs were calculated using patient level costing data. Economic model used to estimate the cost of untreated malnutrition | Malnutrition increased costs by AU$1745 | AU$10.7 million in 2003-2004 |
| Australia | Banks et al. (2010)231 Hospital patients ≥18 years (n=241,415 hospital discharges) |
Hospital | Economic model | Costs based on hospital discharge data, incidence of pressure ulcers (PU), effect of malnutrition on the development of PU, effect of PU on LOS, cost of patient bed day. | NR | Cost of PU attributable to malnutrition in 2002/2003: AU$12,968,669 (SD$4,924,148) |
| Belgium | Ethgen et al. (2005)232 Malnourished (n = 927) vs. well-nourished (matched controls n = 26067) (age NR). |
Hospital | Observational analysis | Compared overall hospital costs of malnourished vs. well-nourished | Mean cost difference per patient’s hospital stay between malnourished and well-nourished €1,152 (95% CI €870; €1433) | NR |
| Canada | Curtis et al. (2016) Adult patients ≥18 years admitted to surgical or medical wards (n = 958) |
Hospital | Multi-center Prospective cohort study | LOS calculated for each participant by tracking admissions and transfers. Standardised data on per diem expenses and direct expenses for functional units purchased from the Canadian Institute for Health Information | Total additional cost of malnutrition at hospital admission roughly estimated to be: Severely malnourished: 38% higher total costs than well-nourished (p = 0.002) and 55% higher medical costs (p=0.003). Moderately malnourished: 31% higher total costs than well-nourished (p = 0.003), 29% higher medical costs (p=0.004) and 34% higher surgical costs (p = 0.022) |
Approx. $1.56 to $2.1 billion per year |
| France | Melchior et al. (2012)204 Hospital patients undergoing Colorectal cancer surgery |
Hospital | Post-hoc analysis of prospective study | Individual costs were calculated by mean LOS × hospitalisation costs valued according to the French National Cost Construction Study (2008) | Cost of hospitalisation increased by €3360 per patient for malnourished vs. non-malnourished | €10,159,436 per annum |
| Germany | Thomas et al. (2016)207 Hospital Surgical patients mean age 57.3 years |
Hospital | Prospective observational study | Cost compensation calculated using the German Diagnosis-Related Group (G-DRG) system | Re-imbursement of €1979.67 per patient at risk for malnutrition and total re-imbursement for all malnourished patients €79,186.73 | NR |
| Portugal | Guerra et al. (2016)233 Hospital Adults aged 18-91 years |
Hospital | Prospective observational study | Hospitalisation cost was calculated for each inpatient based on the amounts defined by the discharge DRG codes | Cost of a nutritionally-at-risk or undernourished patient is between €416 (95% CI = €156-675) and €617 (95% CI = €293-855) higher than the average of the respective DRG | NR |
| Singapore | Lim et al. (2012)51 Hospital Adults aged 51.9 years ± 15.4 (n = 818) |
Hospital | Prospective study (matched case-control) | Hospital costs calculated according to DRG codes | Mean difference between the actual hospital cost and the average cost of hospitalisation for malnourished patients (SGA B+C) was greater than for well-nourished patients S$1392±6150 vs S$488±3494 (p = 0.014) | NR |
| Spain | Gastalver-Martín C et al. (2015)209 Adults |
Hospital | Prospective observational study | Individual costs calculated per patient on discharge (see Figure 1.33) | Hospitalisation costs increased for patients that were malnourished 1747.95 (p = 0.015). Hospitalisation costs: 4158.90€ +4148.51 malnourished vs. cost of non-malnourished 2864.21€ | NR |
| Spain | Álvarez Hernández et al. (2015)208 Adults with dysphagia (mean age 69.15 years) |
Hospital | Observational study | Costs based on average cost/day of admission provided by the Ministry of Health and Consumer Affairs (2009) | Increased costs for malnourished subjects €8004 ± 5854 vs. €6967 ± 5630, p = 0.11 Note result ns. | NR |
| Spain | Leon-Sanz et al. (2015)199 Adults mean age 73.7 years (malnourished) 60.48 years (controls) |
Hospital | Case-control study | Costs calculated from direct costs of treatment and services and extrapolated to estimate national costs | Hospitalisation costs higher in malnourished €8590 ± €6127 vs. not malnourished €7085 ± €5625, (p = 0.015) | €1.143 billion per annum |
| Spain | Marco et al. (2011)52 Adults (mean age malnourished 72.37 years (sd 17.89) vs. not malnourished 70.82 years (7.21)) (n =>1.5 million) |
Hospital | Retrospective analysis | Malnourished patients identified from the Minimum Basic Data Set from Spanish hospitals, costing data also obtained from this | Cost per patient mean (sd): malnourished €5228.46 (€4593.04) vs. non-malnourished €3537.8 (€2858.07), p<0.001 | NR |
| Switzerland | Khalatbari-Soltani and Marques-Vidal (2016)53 Adult patients (≥18 years) |
Hospital | Retrospective study of electronic administrative data | Actual costs for each patient extracted from the hospital billing system | Hospital costs higher in at risk patients vs. not at risk patients (excess 5642.25±1479.80 CHF in 2013 and 5529.52±847.02 CHF in 2014) | NR |
| UK | Gomes et al. 2016212 Stroke patients (mean age 74.7 years) |
Hospital | Prospective observational study | Costs based on hospital payment system in place in England (2012-2013) | Hospitalization costs increased with malnutrition risk category, from a median of less than £5000 (low risk) to more than £8000 (high risk) (p<0.001) | NR |
| US | Weiss et al. (2016)72 All non-maternal and non-neonatal hospital inpatient stays (n=27.6 million) |
Hospital | Descriptive summary report of Health care Cost and Utilisation Project (HCUP) | Administrative health care data from the National (Nationwide) Inpatient Sample (NIS) | NR | In 2013, hospital stays involving malnutrition accounted for nearly $42 billion or 12.1% of aggregate non-maternal, non-neonatal hospital costs |
| Community | ||||||
| Germany | Baumeister et al. (2011)234 Adults (55-74 years) |
Community | Economic study using population based cohort | Costs calculated by self-reported health-care resource use and standard costs based on official statistics | Predicted annual cost at 10 year follow-up €1383.16 (mean GNRI) vs. €2040.43 (low GNRI) | NR |
| Spain | Rodríguez-Mañas et al. (2014)224 Older adults (age NR) |
Community (including those living in institutions) | Systematic review | Costs calculated from malnutrition prevalence, GP visits and hospitalizations. Unit costs were derived from health care cost databases available in Spain (Euros, 2014) | Annual cost of malnourished patient (™5,000.66) was 3.5 times higher than that of a well-nourished (€1,433.78). | NR |
| The Netherlands | Meijers et al. (2012)235 Nursing home residents (110 nursing homes, 9855 patients) |
Nursing homes | Economic study based on data obtained by a survey of 30 dietitians | Costs calculated based on individual treatment and resources, malnutrition prevalence and extrapolated to entire nursing home population | Additional costs €8000/patient/year for at risk patient €10000/patient/year for malnourished patient | Additional costs of malnutrition in nursing homes €279 million/year |
| UK | Collins et al. (2011)238 COPD patients (age NR) |
Community | Prospective study | Costs calculated according to Department of Health NHS reference costs 2007 | Highest costs associated with being underweight (BMI < 20 kg/m²) (Actual costs NR) | NR |
| UK | Guest et al. (2011)80 Adults ≥18 years (mean age 63 years) |
Community | Economic study based on The Health Improvement Network database (THIN) | Costs calculated using a computer based model using the THIN dataset and costs based on 2007-08 prices | Cost per patient over 6 month period was £1753 (95% CI: £1628; £1878) per malnourished patient and £750 (95% CI: £684; £816) per non-malnourished patient | £3.7 billion for the first 6 months after diagnosis of malnutrition (based on incidence of malnutrition in community of 6%) |
| USA | Snider et al. (2014)223 Covers all ages and genders |
Community | Economic model based on population surveys, current literature and census information | Cost of community-based DRM was estimated using a burden of disease approach | $508 per U.S. resident | $156.7 billion ($51.3 billion associated with >65 years) |
| Children | ||||||
| USA | Abdelhadi et al. (2016)200 Children (≤17 years) |
Hospital | Retrospective analysis using patient-level data on hospital inpatient stays | Costs based on the 2010 Healthcare Cost and Utilization Project | Hospitalisation costs were US$55,255 for children with a malnutrition diagnosis vs. US$17,309 without | NR |
| Thailand | Kittisakmontri and Sukhosa (2016)237 Children >5 years (mean age 26.8 ± 1.8 months) (n = 105) |
Hospital | Prospective cohort study | Direct costs were calculated individually | The cost (median (range)) of: Bed, 3500 Baht (400.0-12,400) vs. 2275 Baht (400.0-36,400) p = 0.01), enteral formula 86 Baht (0-3300) vs. 312 Baht (0-16332); p<0.01 medical apparatus 2371.5 Baht (460-345,936) vs. 8074 Baht (240-125,667); p=0.01 and nursing care, 5920 Baht (582-119,520) vs. 11,235 Baht (1300 – 37,970); p=0.02 were significantly higher in the group of children classified as having stunting and wasting compared to those who were well nourished. Note difference in overall costs was ns | NR |