
3.3.1.2 PREVALENCE OF PN USE
 The prevalence of PN in hospital patients varies across countries
- Data on the prevalence of PN in hospital patients are scarce. The 2016 worldwide NutritionDay prevalence study of nutrition practice in intensive care, which included all patients present on the morning of the annual one-day audits from 2007 to 2013, found that about 10% of patients received TPN during their stay in ICU, with usage peaking at day 5–6 (~12% of patients). Use of combined PN and ETF (i.e., SPN) increased with length of ICU stay, reaching a maximum of 12% of patients during week 2 of ICU stay.224 Table 3.12 summarises the data on use of PN from national reports uploaded to the NutritionDay survey website (www.nutritionday.org). These reports contain data from participating units in each country for a given year compared with the worldwide average (reference data). Reports are publicly available for countries with at least six participating hospitals. Data from selected countries are presented to illustrate variability in PN prescribing across countries; these data include all hospital-administered PN and are not reported separately for the ICU—the prevalence of PN is likely to be higher for ICU patients.
- PN use varied significantly between ICU and non-ICU wards across Europe from 2006 to 2019. In ICUs, the proportion of patients receiving PN increased from 11% on admission to 20% on day 2 and 33% by day 5. In contrast, PN use in non-ICU wards remained lower, rising from 3.4% on admission to 3.9% after one week and 5.0% after two weeks. ICU patients receiving PN were more frequently sedated (38% vs. 23%) or intubated (53% vs. 37%). PN use also varied by country, with Sweden, Austria, France, Greece, and Italy reporting the highest ICU rates (>25%), while non-ICU prevalence ranged from 1% to 13%, highest in Sweden, Italy, Denmark, Norway, and Finland. These findings highlight substantial differences in PN practices across European hospitals over the 14-year period.225
Table 3.12
NutritionDay country-specific data on use of ETF, PN and SPN (ETF + PN)*
| Country | No. of patients | Patients with any ICU stay (%) | Patients receiving nutrition support, all hospital (includes ICU) (%) | ||
|---|---|---|---|---|---|
| ETF | PN | ETF + PN | |||
| Australia | 198 | 9.09 | 1.52 | 0.51 | – |
| Austria | 321 | 3.43 | 7.17 | 2.8 | 0.93 |
| Belgium | 2,514 | 12.1 | 4.73 | 2.23 | 0.4 |
| Brazil | 700 | 17.4 | 8.86 | 1.0 | 0.29 |
| Canada | 737 | 10.4 | 1.76 | 1.76 | 0.54 |
| China | 253 | 31.6 | 9.09 | 10.3 | 7.91 |
| France | 396 | 16.2 | 11.1 | 4.04 | 2.53 |
| Germany | 533 | 22.9 | 18.2 | 5.07 | 2.25 |
| Great Britain | 97 | 12.4 | 10.3 | 3.09 | 5.15 |
| India | 286 | 28.7 | 4.55 | – | 0.35 |
| Italy | 122 | 0.82 | 34.4 | 9.02 | 4.92 |
| Japan | 1,313 | 6.93 | 2.44 | 14.0 | 1.29 |
| Norway | 634 | 16.4 | 10.9 | 7.41 | 1.74 |
| Spain | 339 | 5.9 | 6.78 | 2.36 | – |
| Sweden | 182 | 7.14 | 1.10 | 8.79 | 0.55 |
| US | 2,806 | 8.8 | 1.67 | 1.03 | 0.25 |
| United Arab Emirates | 85 | 22.4 | 12.9 | 4.71 | – |
Reference data from units with comparable patients: 2014 (n = 14,603): EN, 5.9%; PN, 3.2%, ETF + PN, 0.62; 2011 (n = 14,207): EN: 8.0%, PN: 4.5%, ETF + PN: 0.99.
*Data are from 2014 NutritionDay survey except for Canada, which are from the 2011 survey. Source: Data taken from individual country reports uploaded to www.nutritionday.org
- Analysis of data (2002–2011) from the Nationwide Inpatient Sample and the Kid’s Inpatient Database in the US found that of 2.1 million paediatric patients (aged 1 month–17 years) hospitalised per year, more than 54,600 had a coded diagnosis of malnutrition. Of these patients, 15.7% received artificial nutrition (PN or EN) and 8.7% received PN, compared with 2.8% and 2.1%, respectively, for patients with no coded diagnosis of malnutrition (n = 2,089,755). Patients diagnosed with protein-calorie malnutrition (n = 7,203) were most likely to receive artificial nutrition (enteral or parenteral) (22.0%), and in particular PN (14.5%).226
- Further highlighting the variability in PN use, a retrospective cohort study of 82,142 paediatric inpatients across US children’s hospitals found that PN utilisation rates varied widely, ranging from 5.9 to 76.7 PN patients per 1000 inpatient encounters. Hospitals were categorised into low-, medium-, and high-use tertiles, with high-use hospitals initiating PN significantly earlier than low-use hospitals. However, PN duration and hospital length of stay did not significantly differ between hospitals with varying PN use. This large variability suggests that PN practices remain inconsistent across institutions, emphasising the need for hospital quality improvement initiatives to enhance adherence to evidence-based PN guidelines. 227
- Over the 4-year survey period at Federico II University Hospital, artificial nutrition was administered to 2,505 patients, with parenteral nutrition (PN) being the most commonly used modality (59.8%), followed by oral nutritional supplements (26.1%) and enteral nutrition (EN) (9.3%). The use of PN slightly decreased over time—from 62.9% in 2004 to 56.3% in 2016—while EN use significantly increased from 6.9% to 13.7% (p = 0.0003), reflecting a shift toward evidence-based practices favouring EN when feasible. In oncologic patients, PN was mainly indicated for postoperative care (53.5%), whereas in nononcologic patients, PN was prescribed more evenly across indications such as postoperative status (25.2%), anorexia (24.8%), and malabsorption (24.1%). EN was predominantly used for dysphagia, particularly in nononcologic patients (54.4%), and to a lesser extent for anorexia and nausea. This trend highlights a growing adherence to clinical guidelines promoting enteral over parenteral nutrition whenever the gastrointestinal tract is functional.228
- In a multicentre prospective observational study in a Spanish ICU cohort (n=639), EN was the predominant route of nutritional therapy, administered to 63.4% of patients, with PN used in 18.2%, and combined strategies (EN-PN or PN-EN) in the remainder. Most patients (74.8%) received early EN within 48 hours, and nutritional therapy was continued for a median of 8 days.229
SPN may be underused in critically ill patients who do not receive adequate nutrition intake from ETF alone
- The Screening Day study—an observational study on ICU nutrition support practices in Latin America (Argentina, Brazil, Chile, Colombia, Ecuador, Mexico, Panama, and Peru) involving critically ill adults who received artificial nutrition (ETF and/or PN) on both the screening day and the previous day, reported that fewer than 1 in 10 patients (9.4%) received PN alone and 10.7% received PN in combination with ETF.230 However, the authors noted that 40% of patients receiving nutrition therapy did not achieve their target caloric intake, and that use of PN and SPN should have been higher given the clinical characteristics of the study population (75% of patients required mechanical ventilation; 74% had suspected moderate or severe malnutrition; one-third had a contraindication or intolerance to ETF).
- A large study that analysed claims data from the Premier Perspective database (the largest inpatient clinical database in the US) found that PN was used more frequently in non-critical care settings than in the ICU, based on data from 106,374 patients (all ages) who received PN during the study period (January 2005 to December 2007).231 PN was most frequently used in the non-critical care setting (n = 66,217), followed by the neonatal ICU (n = 28,06) and the adult ICU (n = 20,140). The most common primary diagnosis requiring PN was intestinal or peritoneal adhesions with obstruction, followed by acute pancreatitis, septicaemia, and diverticulitis. Malignancy was the most common comorbidity in patients requiring PN, for both adult (38.9%) and paediatric (25.6%) patients. The average duration of PN was similar for non-critical care and critical care (6.5 vs 6.1 days) but was longer in the neonatal ICU (8.9 days).
- In a 7-year international analysis of 9777 ICU patients from 880 units across 46 countries, EN was administered to 4889 patients (approximately 50%), with a mean duration of 15.2 ± 28.9 days. EN was initiated in 50% of patients on the first ICU Day and in 75% by day 4. In contrast, PN was prescribed to around 10% of patients, with its use increasing over time. Combined EN and PN reached a peak prevalence of 12% during the second ICU week and remained at that level through day 180. These findings highlight substantial variability in nutrition practices, with delayed initiation and underuse of EN and PN in many patients. 224
Use of PN in the ICU may be declining in some countries after decades of growth
- Examination of US trends in hospital PN using data from the Healthcare Cost and Utilization Project (Agency for Healthcare Research and Quality) showed that use more than tripled during 1993–2010 but has declined in the following four years (Figure 3.55), even after adjusting for total number of hospital discharges, which have also decreased in recent years (Figure 3.56).17 However, when stratified by age, PN use has not changed for paediatric patients <1 year of age (0.3% of hospital stays). It is suggested that this apparent decline in PN use in the ICU may be due in part to its expanded use outside of the critical care setting.
- Between 2001 and 2014, the overall use of TPN in the United States increased significantly, rising from 25,075 patients in 2001 to 33,435 in 2014, with a peak of 43,350 patients in 2012. This upward trend was primarily driven by increased use in teaching institutions, where TPN use rose from 13,231 patients in 2001 to 24,630 in 2014, peaking at 26,935 in 2012. In contrast, non-teaching institutions initially saw a rise, peaking at 17,920 patients in 2011, followed by a significant decline to 8,805 patients in 2014 (Figure 3.57). These divergent patterns suggest differing clinical practices or institutional policies influencing TPN use across hospital types.232
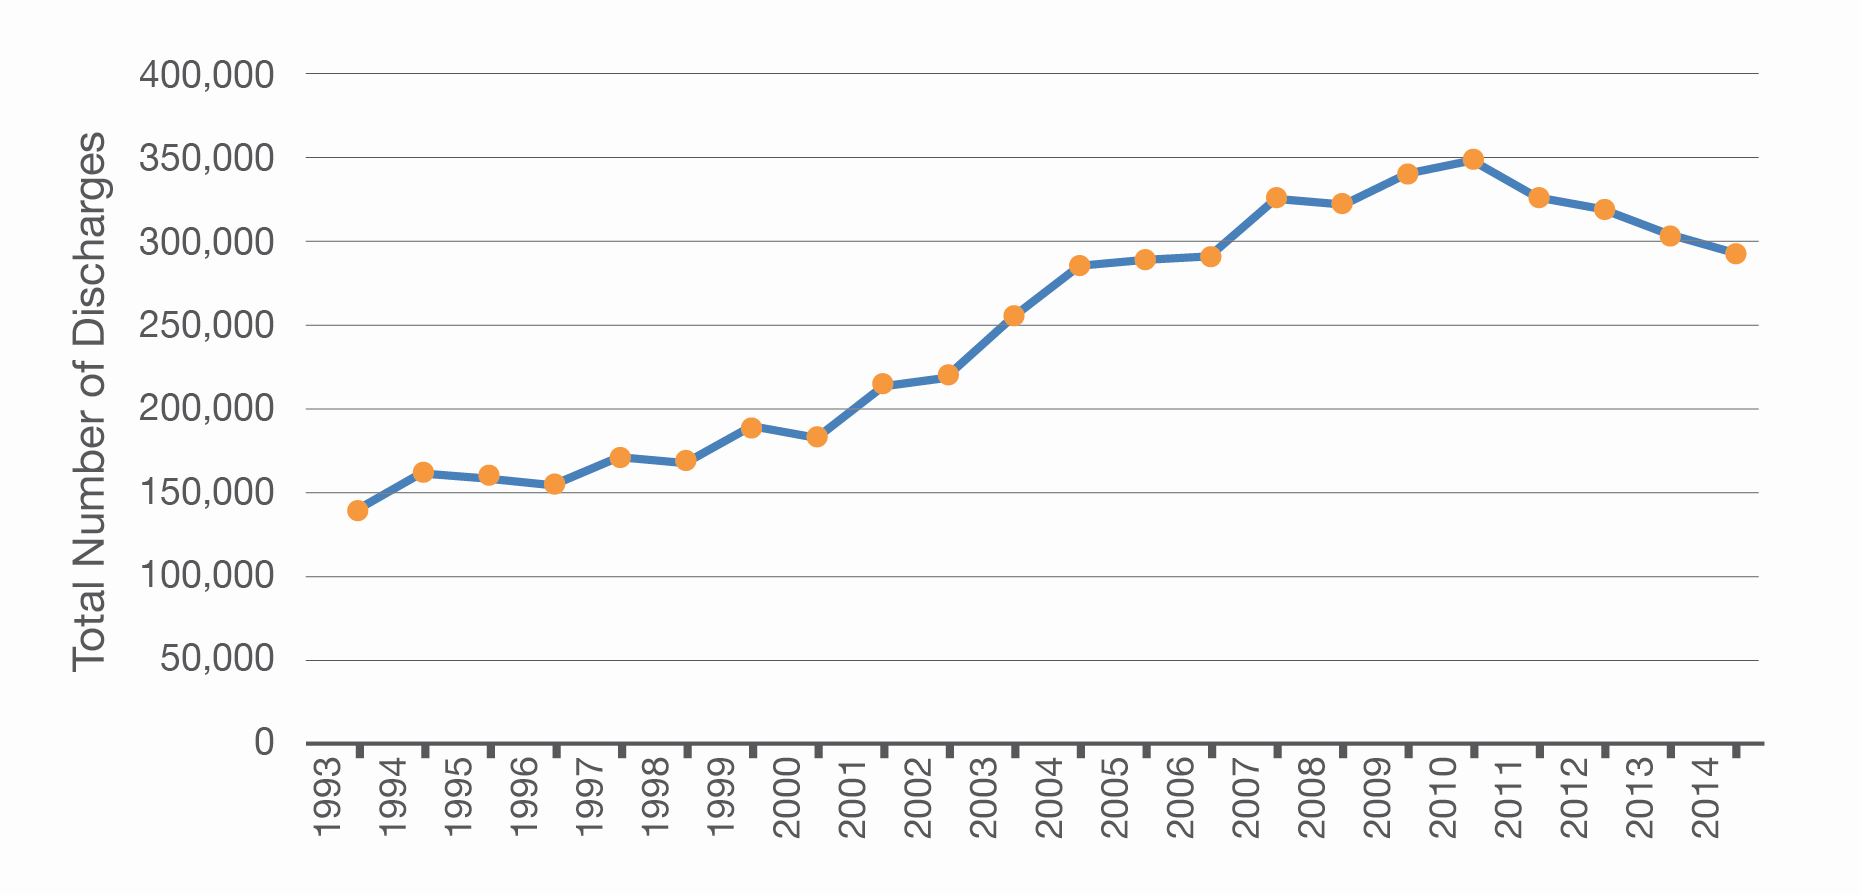
Figure 3.55
Total number of hospital discharges with the ICD-9 code of 99.15, parenteral nutrition, 1993–2014. Data from National Inpatient Sample of the Healthcare Cost and Utilization Project from the Agency for Healthcare Research and Quality (http://hcupnet.ahrq.gov/) (adapted from Worthington et al. 2017)
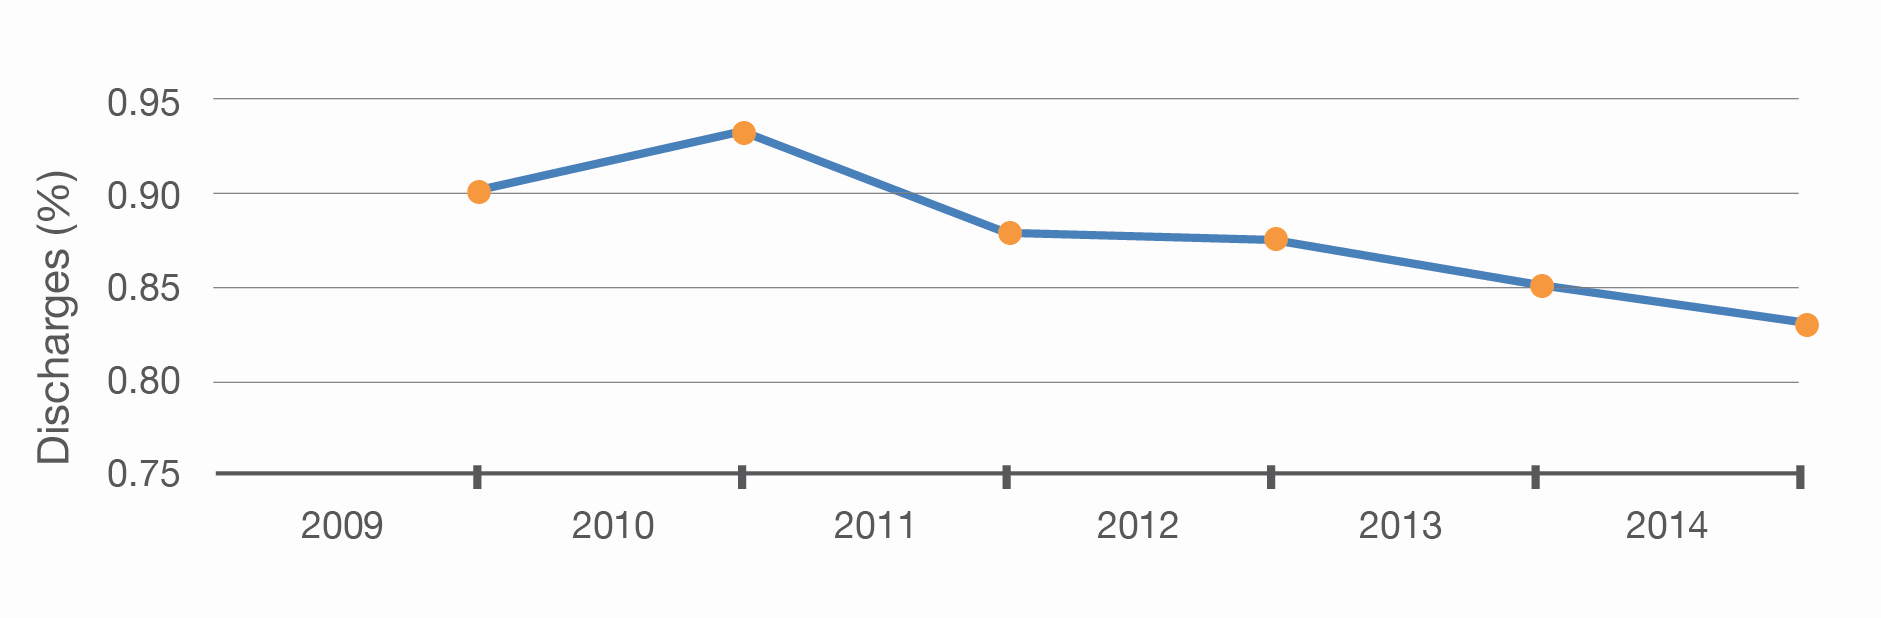
Figure 3.56
Parenteral nutrition use as a proportion of total hospital discharges. Data from National Inpatient Sample of the Healthcare Cost and Utilization Project from the Agency for Healthcare Research and Quality (adapted from Worthington et al. 2017)17
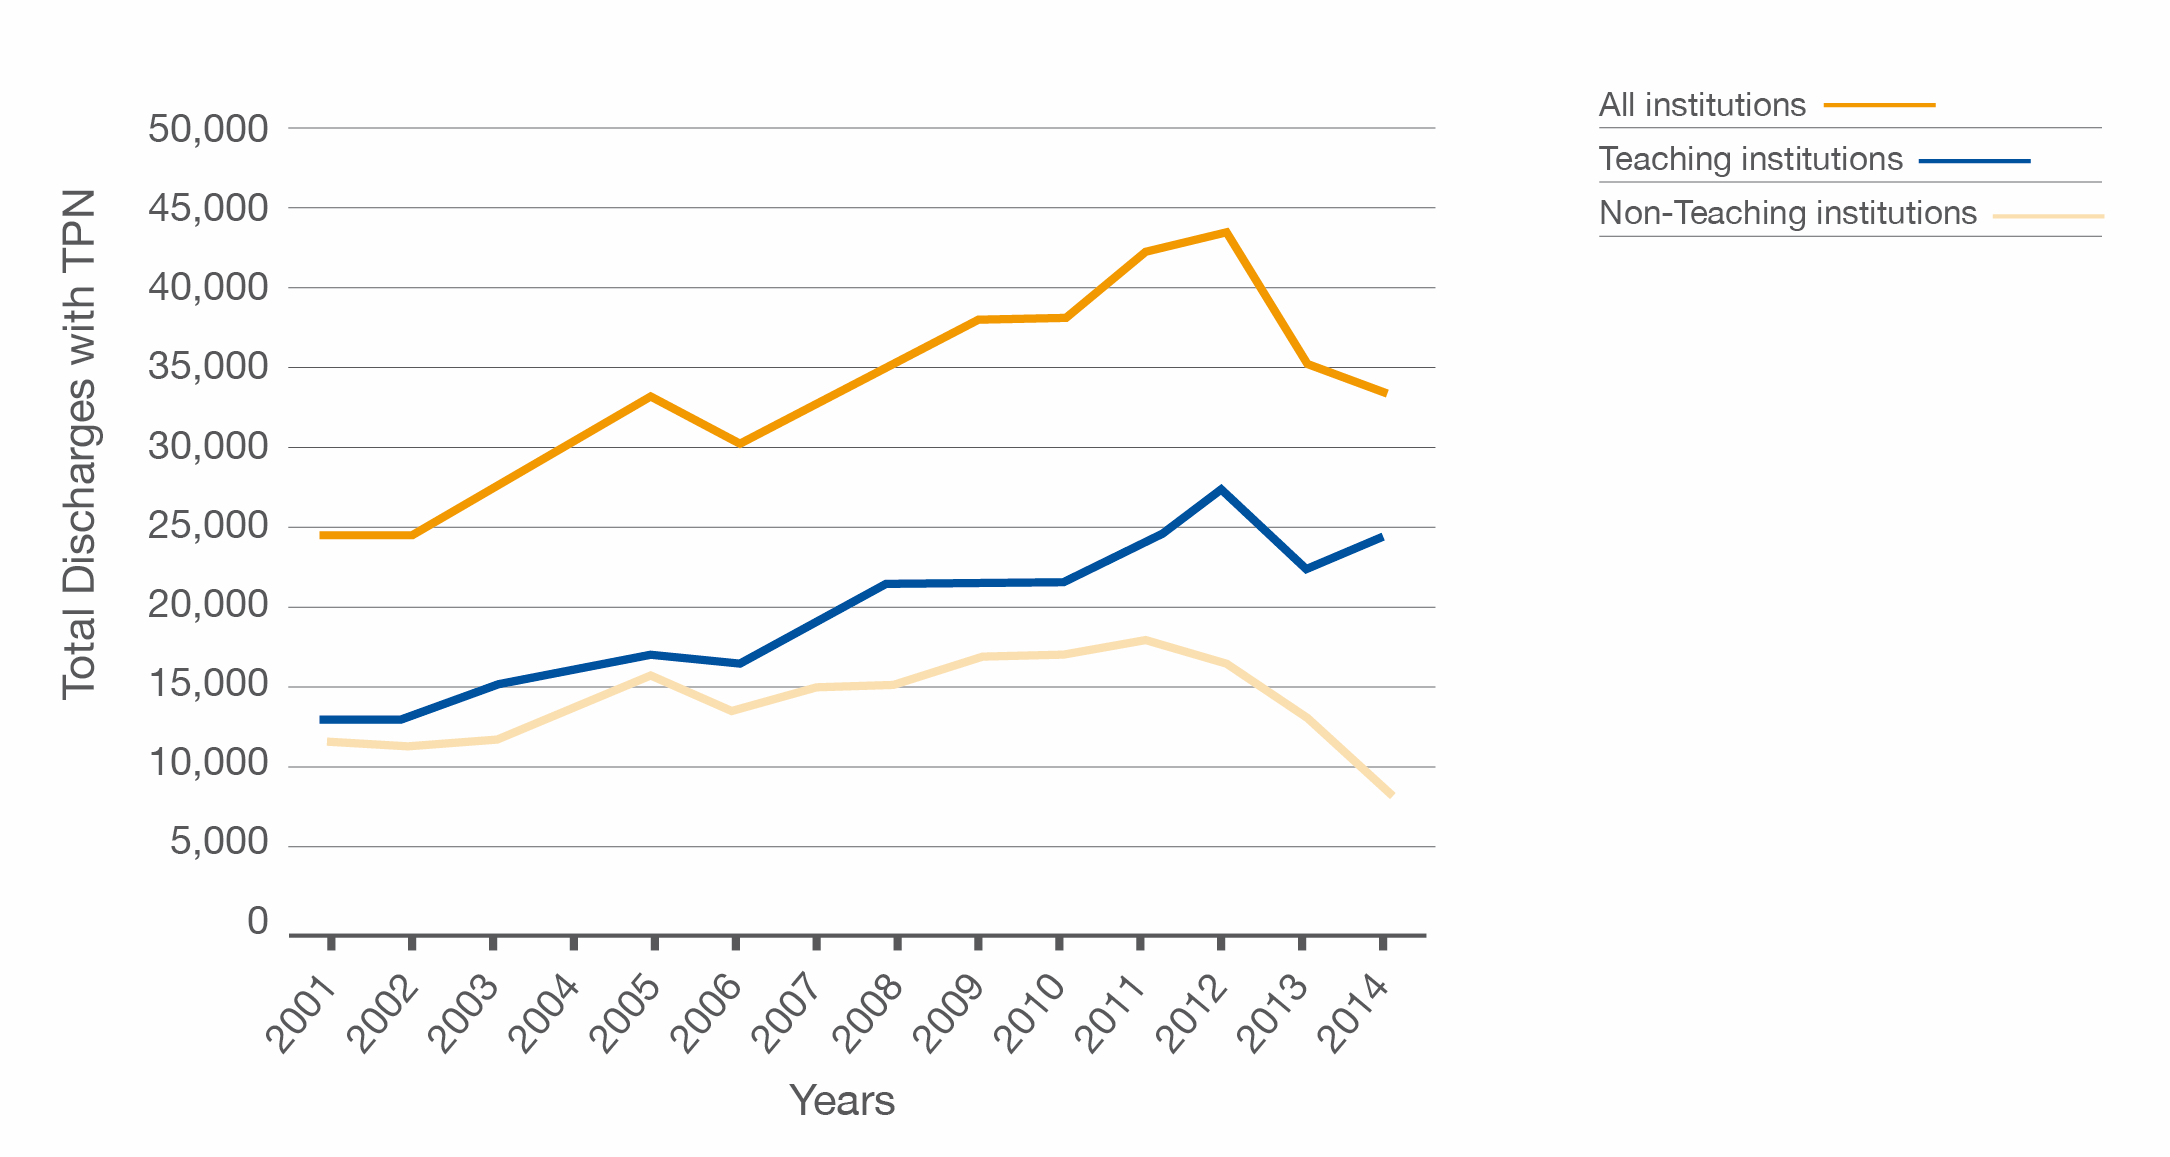
Figure 3.57
TPN usage trends in teaching vs. non-teaching institutions from 2001 to 2014. (adapted from John et al. 2017) 232
- Similarly, a retrospective analysis of data from the Project IMPACT database in the US, a voluntary fee-based ICU registry, showed that use of PN has decreased from 7.2% in 2001–2002 to 5.5% in 2007–2008 (p < 0.001).233 Decline was most evident for emergent surgical patients, patients with moderately severe illness, patients in the surgical ICU, and patients admitted to an academic facility (p ≤ 0.01 for all interactions with year).
- Again, this decline in PN in the ICU may be partly explained by its expanded use outside of the acute setting. In addition, current guideline recommendations are based on meta-analyses of predominantly older studies that show an increased rate of infections with PN compared with EN, which may influence perception of the risks versus the benefit with PN in current clinical practice.17 Also, when PN was introduced, it was prescribed extensively across a wide range of indications – and often irrespective of the patient’s nutrition status or the functional status of the gut, suggesting that PN use was not always appropriate.17 However, evidence-based guidance on the safe management of PN in both the hospital and community setting has helped to maximise the clinical benefit of PN while minimising harm. Indeed, more recent studies in which PN is administered using modern protocols indicate that PN can be safely administered to critically ill patients without impairing outcomes.17 For instance, two multicentre randomised studies involving 2,338 and 1,372 critically ill patients, found no increased risk for infectious complications with PN compared with ETF.234, 235 Moreover, a systematic review of studies published up to July 2015 to compare rates of catheter-related (CR) bloodstream infection (BSI) in patients who did and did not receive PN reported that analysis was insufficient to determine whether patients receiving PN are at increased risk of CR BSI compared with ETF, and that gold-standard practices on the insertion and maintenance of central catheters are achievable in this population.236 Likewise, prospective longitudinal data indicate that HPN is associated with a relatively low rate of CR complications,237-239 even in patients with cancer who are likely to have compromised immune function. Innovative technologies in PN delivery, such as premixed ready-to-use MCBs have also been shown to reduce the risk for BSI,240, 241 and recently published ESPEN guidelines on clinical nutrition in surgery recommend that all-in-one (three-chamber bag or pharmacy prepared) PN solutions should be used inpreference to multibottle systems to reduce the risk for BSI.8
- PN in critically ill patients remains a debated topic, with guidelines generally recommending EN when oral intake is insufficient and PN when EN is not feasible. While EN is preferred due to its efficiency and lower cost, PN can be crucial in certain cases, especially when gastrointestinal function is impaired. However, PN is associated with risks, including metabolic, infectious, and mechanical complications. Despite conflicting opinions, the decision to use PN should be tailored to the individual patient’s condition, with careful monitoring to manage potential adverse effects and optimise benefits.242
HPN provision varies across countries
- Baxter and colleagues estimated the prevalence of HPN based on a survey completed by members of the ESPEN Home Artificial Nutrition and Chronic Intestinal Failure (HAN CIF) group.243 Period prevalence for 2010 and point prevalence (31st December 2010) were calculated for 16 countries, based on data from 9,200 patients (Table 3.13). Period prevalence ranged from 3.25 cases per million population in Spain to 66 per million in Denmark. The differences in prevalence were suggested to reflect differences in service organisation and attitudes to the provision of HPN for patients with cancer. Period prevalence could not be calculated for Germany; however, the figure is expected to be high as large numbers of patients with cancer receive HPN here.243
Table 3.13
Population, period, and point prevalence of HPN, and number of HPN centres in selected countries (adapted from Baxter et al. 2012)243
| Country | Population (mn) | 2010 period prevalence/mn | 31 Dec 2010 point prevalence/mn | No. HPN centres |
|---|---|---|---|---|
| Australia | 22.2 | 6.7 | 5.1 | 9 |
| Belgium | 10.5 | 11* | 8* | 7 |
| Denmark | 5.3 | 66 | 47 | 3 |
| Republic of Ireland | 4.2 | 10.1 | 7.5 | 0 |
| England | 51.8 | 10 | 8.3* | 21 |
| France | 63.1 | 6 | Unknown | >14 |
| Germany | 82 | Unknown | 49* | Few |
| Israel | 7.85 | 25.5 | Not calculated | 4 |
| Italy | 60 | 33.3* | Unknown | 90* |
| Netherlands | 17 | 14.7 | Unknown | 2 |
| N. Ireland | 1.7 | 18.8 | 14.1 | 1 |
| New Zealand | 4.2 | 7.2 | 5.3 | 1 |
| Poland | 38.2 | 25 | 22.3 | 26 |
| Scotland | 5.3 | 23 | 17.5 | 11 |
| Spain | 46.2 | 3.25 | 2.7 | 7 |
| Wales | 3.0 | 18 | 21 | 2 |
*Estimated prevalence
HPN, home parenteral nutrition; mn, million
The prevalence of HPN has increased in many countries over the past four decades
- Since HPN was introduced in the early 1970s, its use has substantially increased in many countries, possibly because its relatively low associated morbidity and mortality has promoted its extensive use in Western countries.32
- A national survey conducted in 2005 and again 2012 across Italian local health care units found a 66% increase in the prevalence of home artificial nutrition, with use of HPN increasing by 58%.36, 244 The prevalence of HPN (including HPN + home EFT) was 50.2 per million population in 2012, compared with 31.7 (corrected prevalence) in 2005.36, 244
- Analysis of data from the largest Danish IF centre showed an exponential increase in the number of patients discharged with HPN, from one per year in 1970 to more than one per month in the 1980s and more than one patient per week in the 2000s.33
- A retrospective study in Switzerland on the use of HPN during 2005–2009, based on 13,000 adults, reported that the HPN use increased from 2.1% in 2005 to 4.0% in 2009 (overall prevalence, 3.2%).245 However, follow-up data for the period 2010 to 2015, presented at the 2017 ESPEN Congress, found that 1.5% of HAN received HPN during this period.246
- Analysis of data from the Spanish Home Parenteral Nutrition for 2015 reported prevalence of home artificial nutrition (HAN) of 5.08 patients per million. Although not directly comparable, this figure is higher than that reported by Baxter and colleagues (2012) for Spain in 2010 (period prevalence, 3.25).
- A nationwide analysis in Poland from 2010 to 2020 showed a 2.99-fold increase in the prevalence of HPN, reaching 53.26 per million adults by 2020. The patient population shifted toward older age groups (65+), with fewer younger patients initiating HPN. The most common indications were malnutrition (34.3%), GI disorders including malabsorption (20.4%) and postprocedural GI issues (19.6%), as well as GI obstruction due to cancer, primarily gastric (34.7%), ovarian (17.8%), and colon (12.3%) cancers. 247
- A national retrospective study conducted in France in 2019 focused on the epidemiology of HPN in adults aged 20 and over, using demographic data provided by the Institut National de la Statistique et des Études Économiques (INSEE). The adult population analysed included over 50.8 million people, stratified by sex and into three age groups: 20–39, 40–59, and 60 years and over. The incidence and prevalence of HPN were 22.0 and 25.3 per 100,000 inhabitants per year, respectively, with 6.2 per 100,000 receiving HPN for more than 12 weeks. In total, 12,859 adults required HPN in 2019. These findings, derived from comprehensive national insurance data, represent one of the most complete assessments of HPN use to date and suggest a higher prevalence than that reported in previous literature, likely due to the exhaustive nature of the dataset.248
- The British Artificial Nutrition Survey (BANS) report produced by the British Association for Parenteral and Enteral Nutrition (BAPEN) in 2016 stated that the number of new adult HPN registrations increased steadily between 2008 and 2013, peaking in 2013 with 472 new registrations. Moreover, the point and period prevalence in 2015 were the highest ever recorded by BANS, at 1140 and 1360 patients, respectively. Relating these data to the UK population, the incidence of HPN was 6.5 per million in 2015, with a point and period prevalence of 17.1 and 21.1 cases per million, respectively. The true rates may be even higher, given underreporting.
- Analysis of US Medicare data from 9,228 patients estimated the average prevalence of HPN over the 4-year study period to be 238 patients per million.249 However, a study published in 2017 suggests that the prevalence of HPN in the US has since declined: in 2013 6,778 Medicare beneficiaries received HPN. The ratio of Medicare to non-Medicare use of HPN was 0.271, leading to an estimated total of 25,011 patients receiving HPN in the US in 2013 (79 patients per million US population), with adults accounting for approximately 80% of all HPN patients.249
The rising prevalence of HPN in many countries appears to be due largely to expanded use in patients with cancer
- In 1997, the most common indications for long-term HPN in Europe were CD, mesenteric vascular disease, cancer, and radiation enteritis250, 251 whereas more recent data suggests that, in adults, malignancy is now the most common indication for HPN in Europe.
- The Italian national survey found that cancer was the most frequent underlying diagnosis for HPN in adults.36 The prevalence of HPN in patients with GI disease increased the most during the study period (2005–2012) but this represented the smallest patient group.
- An observational study from Bologna, Italy (1990–2019) highlights the role of HAN, particularly HPN, in managing advanced cancer patients. Among 43,474 cancer patients receiving home care, 969 (2.2%) received HAN—mostly HPN (64.9%), primarily due to gastrointestinal obstruction.252
- A longitudinal retrospective study included all patients treated at Hospital General Universitario Gregorio Marañón (Madrid, Spain) who received HPN between January 1986 and October 2012. Among the 91 patients, 116 HPN episodes were recorded. The most frequent indication for HPN was short bowel syndrome (41.1%), followed by neoplasms on palliative therapy (34.1%), neoplasms on active therapy and radiation enteritis (15.4%), and other conditions such as mesenteric ischaemia, Crohn’s disease, and motility disorders. Median HPN duration per episode was 184 days. Cancer-related conditions accounted for nearly half of the HPN cases, particularly in palliative settings. Most patients had limited physical activity and independence; both closely tied to their underlying conditions.253
- Analysis of 7 years of HPN data from the Spanish NADYA group registry showed that patients with a cancer diagnosis receiving HPN increased by 43% from January 2010 to December 2016.254 Furthermore, half of these patients (51.3%) were receiving palliative cancer therapy.
- Retrospective analysis of survey data from Switzerland for 2005–2009 showed that cancer was the underlying disease in half of all HAN patients.245 Follow-up data from 2010–2015 confirmed that patients with cancer represented the largest group of patients receiving HAN (46.0%).246
- A review of 22 studies conducted across Europe, North America, and East Asia, involving 3,564 patients with advanced cancer receiving home parenteral nutrition (HPN), showed varied indications for its use. Most cases involved intestinal failure secondary to malignant bowel obstruction. However, 34% of patients required HPN for other causes, including malabsorption, intractable nausea, fistulae, and short bowel syndrome. Additionally, 21% of patients received HPN for cachexia or treatment-related malnutrition. The studies highlighted that solid tumours of the gastrointestinal tract were the most common cancer type treated with HPN (37.4%), followed by gynaecological cancers (6.8%). The overall prevalence of HPN use in these patients reflects its growing role in managing severe malnutrition and related complications in cancer care. 255
- The 2016 BANS report states that cancer is a major diagnostic indication for HPN, accounting for one-quarter of all new HPN registrations. CD remains a leading diagnosis for adults receiving HPN, accounting for 14% of newly registered patients (point prevalence, 21%). Data from the largest UK single-centre series of adults requiring HPN for Type 3 IF showed a significant reduction in the prevalence of HPN for CD-related IF, from 45% in 1978–1998 to 22% in 2006–2011; the prevalence of HPN for cancer-related IF increased from 2.2% to 9.5% over the same period (both p < 0.05).256
- A retrospective analysis of data from the Canadian HPN registry (established in 2005)257 showed significant changes in the indications for HPN between 2005–2008 and 2011– 2014), with an increased proportion of patients with cancer (37.9% vs 16.7%) but fewer with SBS (32% vs 65.5%).
- This retrospective analysis of cancer patients enrolled in the Canadian HPN Registry (2005–2016) showed that the most common underlying malignancies requiring HPN were gastrointestinal cancers (54.2%), followed by gynaecologic cancers (31.8%). These findings highlight that cancer, particularly of gastrointestinal and gynaecologic origin, is a major indication for HPN in the adult population.258
- A nationwide analysis conducted in Poland from 2010 to 2020 identified cancer as a significant indication for HPN, with 17.3% of primary and 23.16% of secondary diagnoses attributed to malignancies (Table 3.14). The most prevalent cancer types among HPN patients were gastric, ovarian, colon, and pancreatic cancers.247
Table 3.14
Main and secondary diagnosis. (adapted from Folwarski et al. 2021) 247
| Diagnosis. | Primary | Secondary | GI obstruction (Cancer) | n; % |
|---|---|---|---|---|
| n; % | n; % | Gastric cancer | 528; 34.74 |
|
| Malnutrition | 2632; 34.28 |
381; 47.45 | Ovarian cancer | 271; 17.83 |
| Intestinal malabsorption/other intestinal diseases | 1567; 20.41 |
62; 7.72 | Colon cancer | 187; 12.3 |
| Pancreatic cancer | 126; 8.29 | |||
| Postprocedural disorders of digestive system | 1506; 19.61 |
70; 8.72 | Other/non specified/disseminated | 106; 6.97 |
| Rectal cancer | 76; 5.00 | |||
| GI obstruction (cancer) | 1333; 17.36 |
186; 23.16 | Esophageal cancer | 72; 4.74 |
| Uterine cancer | 50; 3.29 | |||
| Liver/ biliary/gallbladder cancer | 25; 1.64 | |||
| Other/Not specified | 204; 2.66 | 65; 8.09 | Small intestine cancer | 22; 1.45 |
| Lungs and respiratory tract cancer | 20; 1.32 | |||
| Urinary blader cancer | 17; 1.12 | |||
| GI obstruction | 198; 2.58 | 28; 3.49 | Mammary cancer | 14; 0.92 |
| Lyphoma | 6; 0.39 | |||
| IBD | 162; 2.11 | 11; 1.37 | IBD | |
| Crohn disease | 130; 75.14 |
|||
| Other intestinal infmation | 35; 20.23 | |||
| Vascular disorders of intestine | 77; 1 | 0; 0 | Colitis ulcerosa | 8; 4.62 |
| IBD—Inflammatory Bowel Disease. | ||||
Use of HPN in patients with cancer varies by tumour type
- A cross-sectional study in France estimated the one-day prevalence of malnutrition and nutrition support in patients with cancer. Based on data on nutrition status collected for 1,903 patients, 39% were identified as being malnourished (likely to be an underestimate as strict criteria were used to define malnutrition). A total of 39.9% of patients received nutrition support (Table 3.15), and of these 9.6% (4% overall) received HPN.167 Cancer of the pancreas (24.3%), uterus/ovaries (21.3%), and oesophagus/stomach (19.6%) were the leading diagnoses for patients receiving HPN. Importantly, more than 40% of patients who were identified as being malnourished did not receive any nutrition support.
- A 32-item questionnaire was conducted to evaluate the use of HPN in advanced cancer (AC) patients across 36 countries. The survey collected 220 responses from 5 continents, with 90% of the responses coming from Europe. The study revealed that gynaecological, colorectal, and upper gastrointestinal cancers were the most common types requiring HPN. Regional differences were observed, with fewer pancreatic cancer patients needing HPN in the UK compared to non-UK regions (13% vs. 35%, p < 0.01). While intestinal failure (IF) was not always required, 66% of respondents started HPN in AC patients with IF, and 24% initiated HPN even without IF (Figure 3.58). The main reasons for starting HPN were improving quality of life and supporting surgery or chemotherapy.259
Table 3.15
Prevalence of nutrition support and HPN use in adults with cancer in 154 non-critical care wards in France (adapted from Hébuterne et al. 2014)167
| Tumour type (n) | % of patients with nutrition support | % of patients receiving HPN |
|---|---|---|
| Pancreas (42) | 66.7 | 24.3 |
| Uterus/ovaries (87) | 32.2 | 21.3 |
| Oesophagus/stomach (103) | 65.0 | 19.6 |
| Blood (377) | 34.5 | 16.2 |
| Colon/rectum (191) | 30.4 | 10.9 |
| Others (160) | 31.9 | 10.2 |
| Lung (247) | 42.9 | 8.1 |
| Kidney/bladder (29) | 41.4 | 7.7 |
| Head and neck (366) | 63.7 | 6.1 |
| Prostate (72) | 13.9 | 4.5 |
| Breast (229) | 14.8 | 4.1 |
| Total (1,903) | 39.8 | 9.6 |
HPN, home parenteral nutrition (i.e. PN administered outside of the critical care setting)
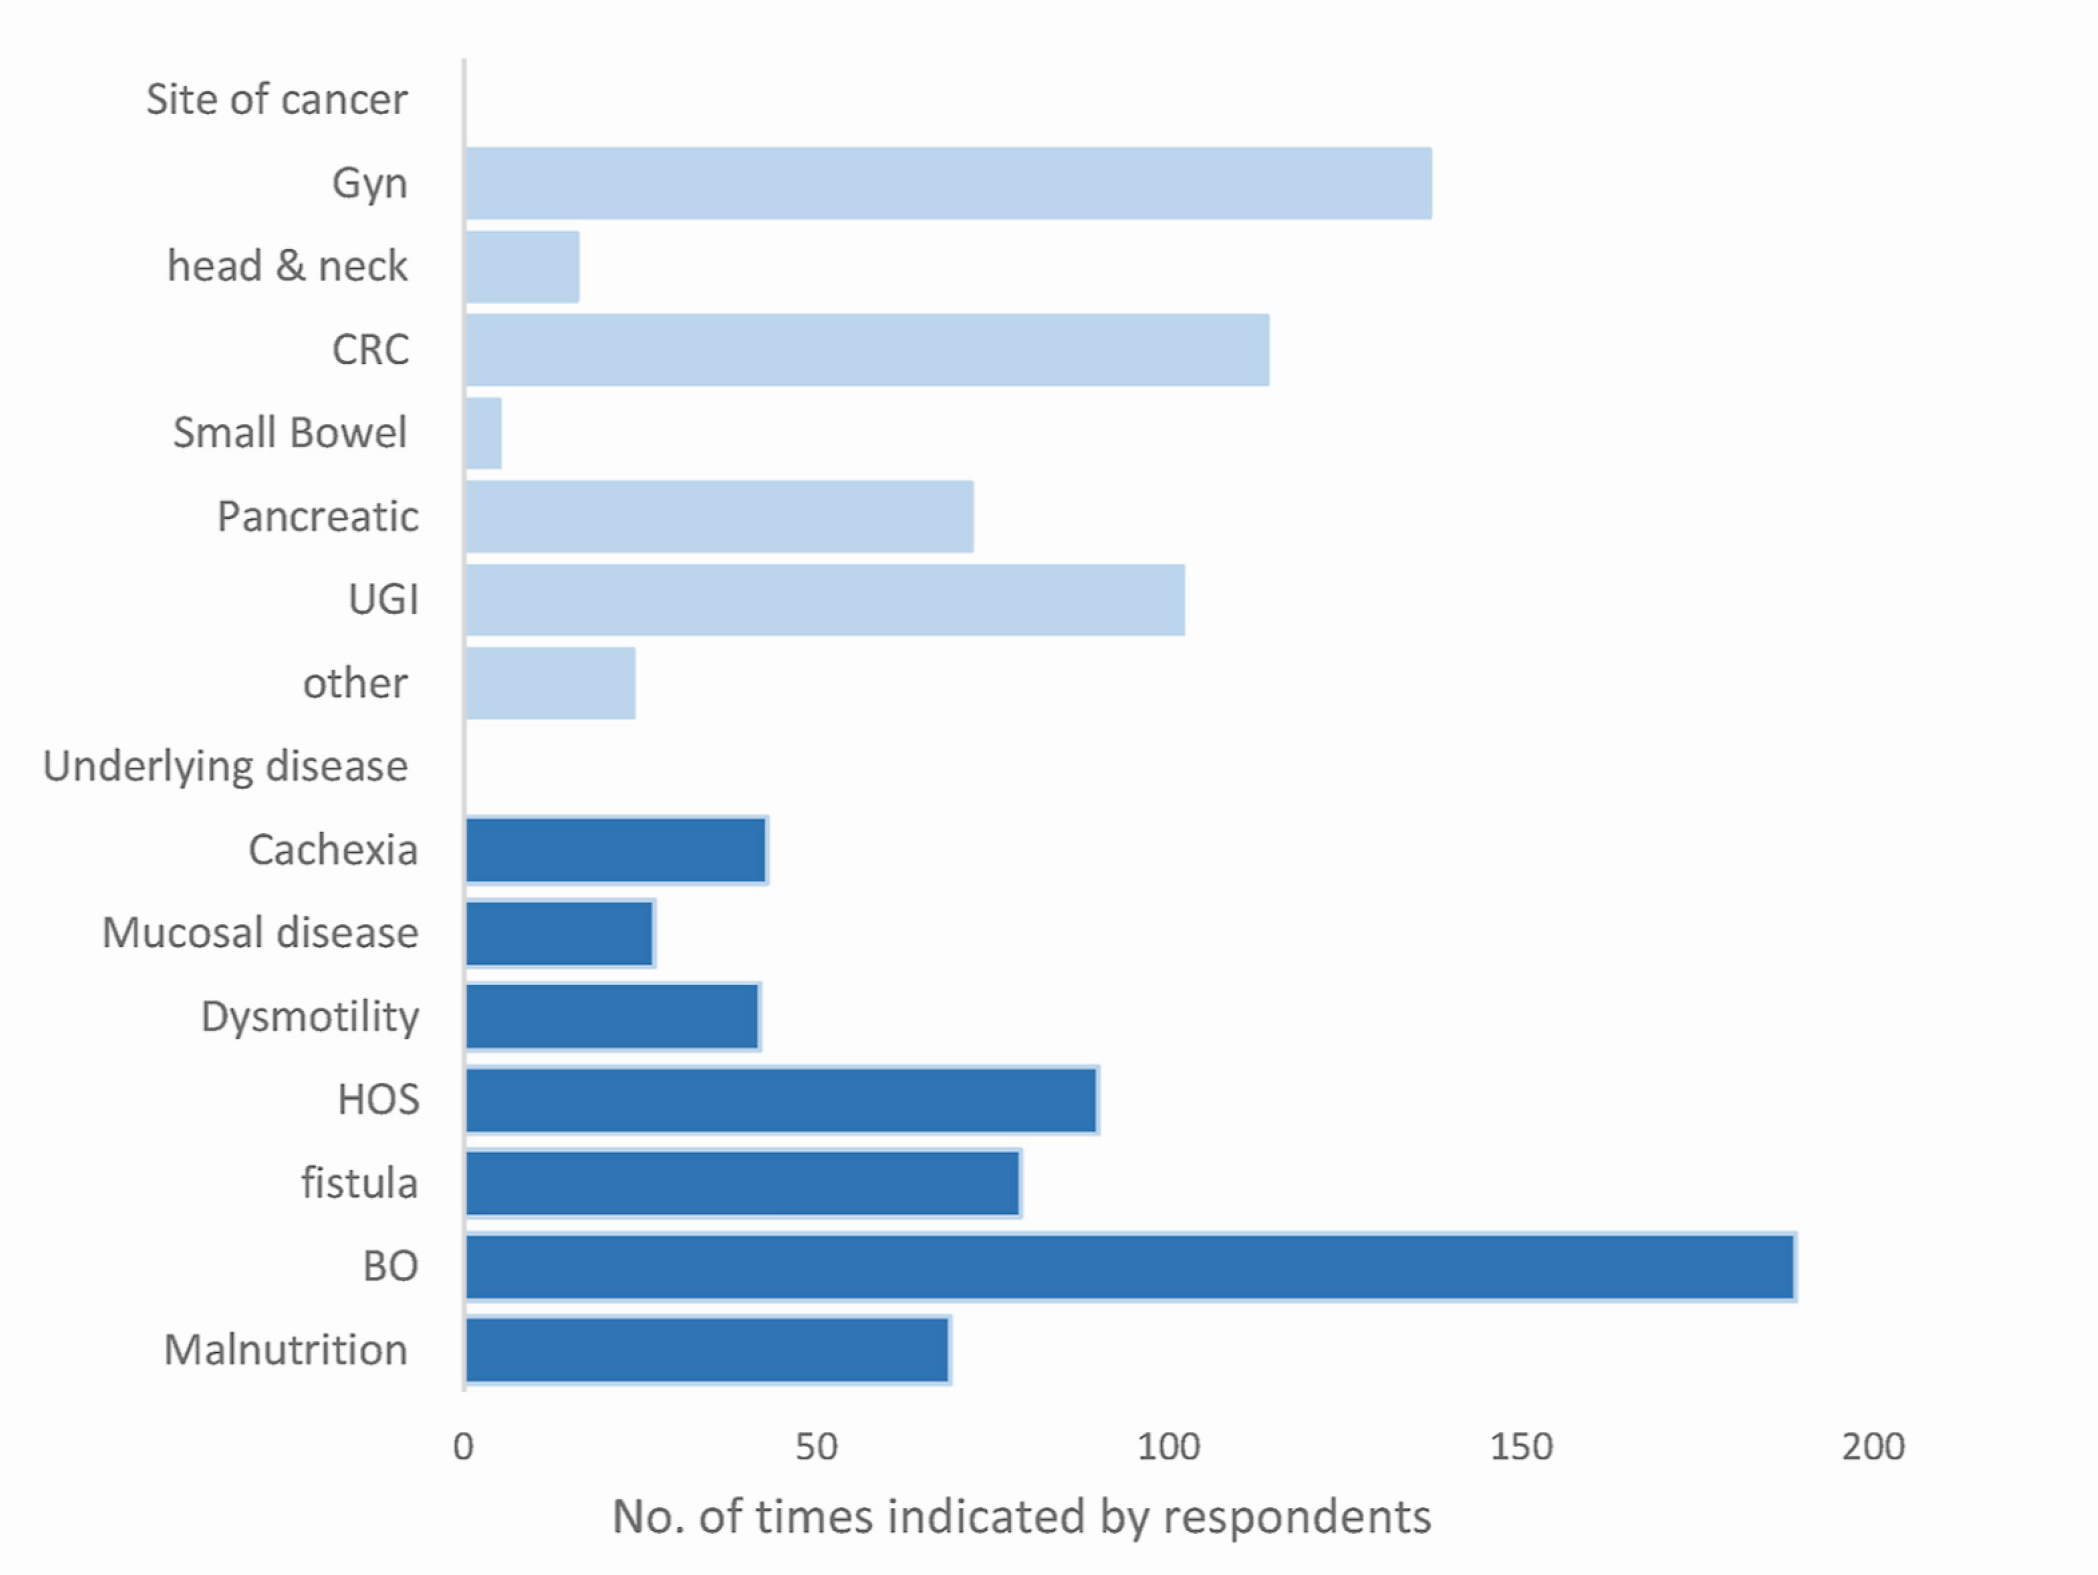
Figure 3.58
Reported indications for HPN showing pathophysiological condition and cancer site (from Naghibi et al. 2022) 259
HOS-high output stoma, Gyn-gynaecological, CRC-colorectal cancer, SB-small bowel, UGI-upper gastrointestinal cancer, BO-bowel obstruction.
Prevalence of paediatric HPN continues to rise in many countries; intestinal failure is the most common indication
- A cohort study conducted in France, in 2015 involving 307 paediatric patients showed a 14.5% increase in the prevalence of HPN use from the previous year, with 95% of patients being treated for primary digestive disease.260
- Analysis of data from the Italian national survey found that IF was the most frequent diagnosis for paediatric HPN in 2012 (58% of patients).36 The prevalence of paediatric HPN increased from 1.2 patients per million population (total prevalence) in 2005244 to 4.1 per million in 2012 (point prevalence).36 Furthermore, the increase in HPN use for paediatric patients during the study period (2005–2012) was double that for adults.36
- Data from 120 children followed at the Intestinal Failure Unit of the Paediatric University Hospital “Regina Margherita” in Turin between 1993 and 2021 were retrospectively collected and analysed. The dataset, which started in 1993, did not include data on the very first patient. Of these, 63 (52.5%) required HPN due to primary digestive diseases (PDD), while 57 (47.5%) needed HPN because of secondary intestinal failure (NDD). The number of HPN cases related to secondary diseases increased over the years. Among PDD cases, the primary causes included short bowel syndrome (61.9%), extensive parenchymal disease (19%), motility disorders (14.2%), and other digestive conditions (4.8%). In contrast, secondary causes of intestinal failure included cancer (47.4%), cystic fibrosis (22.8%), congenital cardiopathy (7%), Neurodisability (7%), and other conditions (15.7%).261
- HPN use in paediatric patients in the UK has risen significantly over the past 20 years, with increased complexity and improved outcomes. A national database was utilised to assess HPN prevalence and patient outcomes. In 2019, 389 children received HPN, representing a prevalence of 30 per million children, nearly double the number reported in 2012. The most common condition was short bowel syndrome, while the number of patients with multisystem disease increased tenfold since 2012, now becoming the second largest category. Overall, long-term HPN in children has shown to be safe, with good survival rates and a low need for intestinal transplantation.262
- A retrospective review of children with severe neurological impairment (SNI) and non-primary digestive disorders who started HPN between 2010 and 2023 at a tertiary paediatric hospital found an increase in HPN initiation for these children over the study period. Among the 205 children included, 18 had SNI and non-primary digestive disorders, and 187 had primary digestive disorders.263
- A survey of the 32 nutrition support teams that register patients with British Intestinal Failure (BIF) showed that the point prevalence of paediatric HPN has risen four-fold in the last two decades.264 In this study data were requested for children (<16 years) with Type II IF (≥28 days inpatients days on PN) and Type III IF (HPN or being prepared for discharge with HPN); 95 Type II and 195 Type III patients were identified. Comparison with data from previous years showed that the point prevalence of Type III IF has risen significantly, from 4.4 patients per million at risk population in 1993 to 16.6 per million in 2012 (p < 0.001). More recently, point prevalence data on paediatric IF from the Paed eBANS National Digital Registry in the UK showed an increase in the number of paediatric HPN patients to 312 in 2015, a rise of 64% from 2012.