
1.4.2 Clinical consequences
1.4.2.1 MORTALITY
Malnutrition is associated with increased mortality in adults and older people
- A comprehensive review of studies addressing the associations between malnutrition and mortality showed that malnourished patients have a higher mortality rate than well-nourished patients. This effect was seen in a wide variety of patient groups and in younger patients:
- general hospital admissions, medical and surgical patients;
- older people in a variety of care settings, e.g. hospital, intensive care, medical units, rehabilitation, and long-term care;
- patients with stable COPD or acute exacerbations;
- patients with Human Immunodeficiency Virus (HIV) and Acquired Immunodeficiency Syndrome (AIDS);
- patients with cancer;
- patients with renal failure prior to dialysis or receiving dialysis;
- patients following stroke;
- patients in the community with chronic respiratory, GI, neurological or cardiovascular disease or cancer.
- In a large (n = 5051, mean age 59.8 years [±0.3 SEM]) multi-region (12 countries; Western Europe = 4, Eastern Europe = 5 and Middle East = 3), multi-centre (26 hospital departments; surgery, internal medicine, oncology, intensive care, gastroenterology and geriatrics) study, death was more frequent in ‘at risk’ patients than ‘not at risk’ patients (12% vs 1%, p < 0.001),i.e. mortality was 12 times higher in ‘at risk’ patients (see Figure 1.24).299
- Malnutrition significantly impacts mortality in older adults with cancer, as it is associated with worse treatment outcomes and reduced survival rates296. Research highlights that malnourished cancer patients often leads to sarcopenia and low muscle mass, both of which contribute to increased mortality risk296.
- A systematic review further confirms that malnutrition is a strong predictor of overall survival in older cancer patients.300
- Another systematic review emphasizes the need for early diagnosis and early intervention290. Further research also stresses that hospitalised older adults with cancer are particularly vulnerable to the effects of malnutrition, which can exacerbate comorbidities and prolong hospital stays293.
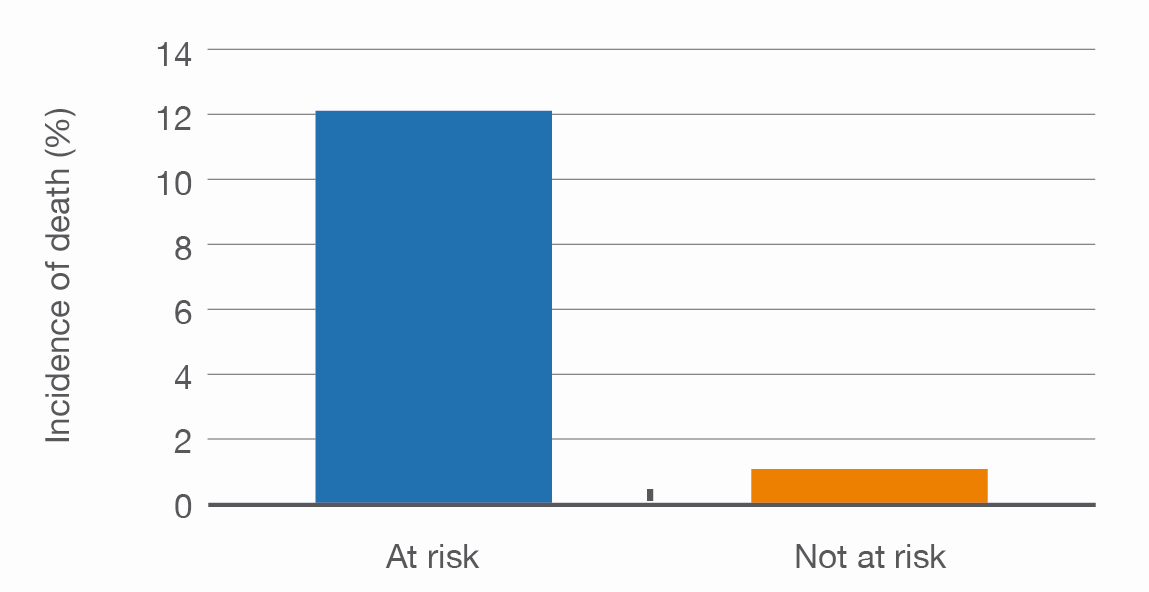
Figure 1.24
Increased frequency of death in at risk patients vs not at risk patients (p < 0.001) (adapted from Sorensen et al. 2008)299
- A prospective cohort study of newly admitted adult patients (18–74 years of age) to an acute tertiary hospital found that the mortality rate was higher in malnourished patients (SGA B+C) than in well-nourished patients at 1 year (34.0% vs 4.1%), 2 years (42.6% vs 6.7%) and 3 years (48.5% vs 9.9%, p < 0.001 for all). Malnutrition was a significant predictor of mortality (adjusted hazard ratio [HR] of 4.4 [95% CI 3.3–6.0], p < 0.001) (see Figure 1.25).73
- A systematic review and meta-analysis assessed the impact of malnutrition on overall survival in older adults with cancer. The analysis included 10 observational studies with a total of 4,692 patients, demonstrating that malnourished individuals had a 73% higher risk of all-cause mortality compared to well-nourished patients (RR = 1.73; 95% CI: 1.23–2.41). A subgroup analysis using the Mini Nutritional Assessment (MNA) further confirmed this association, revealing that malnourished patients had more than double the mortality risk (RR = 2.13; 95% CI: 1.34–3.39).300
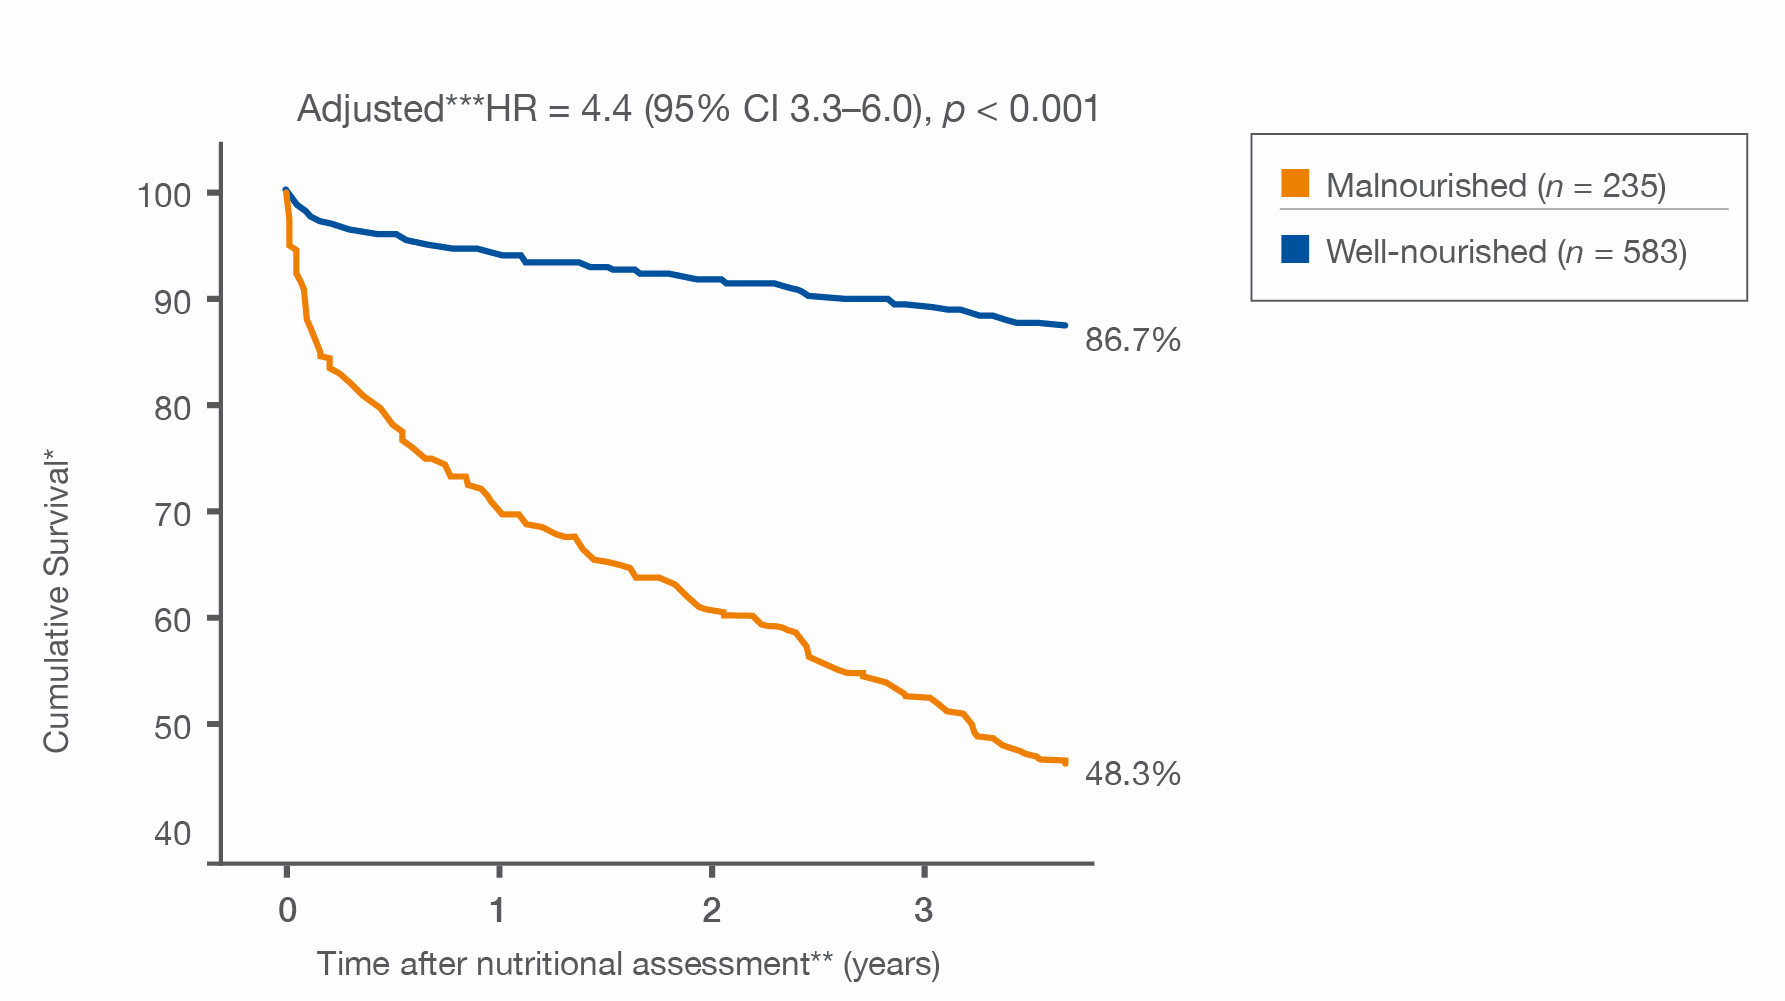
Figure 1.25
Cumulative survival in well-nourished and malnourished patients (n = 818). (adapted from Lim et al. 2012)73
HR: Hazard Ratio. *Survival and mortality data from Singapore Death Registry. **Assessment with Subjective Global Assessment within 48 h of hospital admission. ***Adjusted for ethnicity, age, and gender.
- A survey of outpatients with COPD found that those at risk of malnutrition (medium and high risk using ‘MUST’) were more likely to die within 6 months than patients not at risk (6-month mortality rate 16.3% vs 5.8%, p = 0.023).301
- In a study that analysed the medical records of randomly selected malnourished patients with 996 matched (for age, gender, and GP practice) non-malnourished patients in the UK, malnutrition remained an independent predictor of mortality after adjustment for age and co-morbidity.83
- Two-year mortality in nursing home residents in Sweden was found to be 52%. Male gender and low body weight were associated with increased risk of mortality.258
- DRM has been found to double the risk of mortality in hospital patients and to triple mortality in older patients in hospital and after discharge (see Figure 1.26).302,303
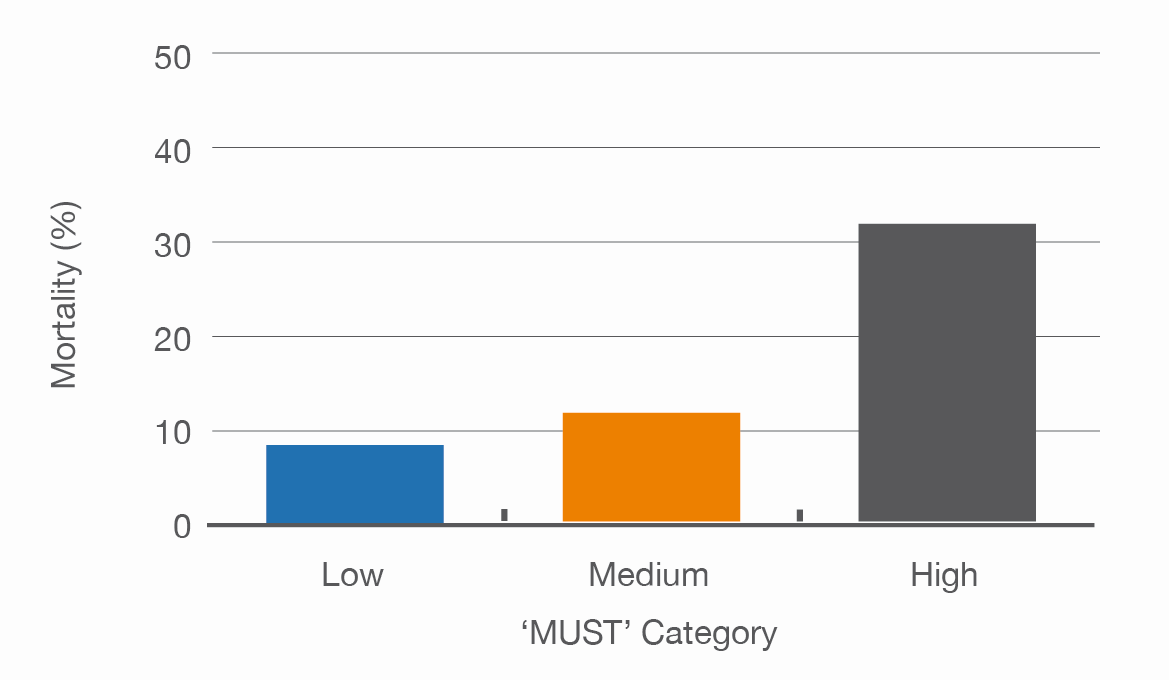
Figure 1.26
Significant increase in in-hospital mortality with increasing malnutrition risk category (p = 0.01) (adapted from Stratton et al. 2006)302
 Malnutrition is associated with increased mortality in children
- Although data demonstrating that malnutrition has an adverse impact on morbidity and mortality in paediatrics is limited, it is clear from extrapolation of studies in adults and from studies in children in developing countries that malnutrition is associated with a greater risk.304
- A study of children operated on for congenital heart defects who died > 30 days after surgery showed that a decrease in WFA during the first months after surgery was strongly related to late mortality.305
- A prospective study of children aged 1–18 years newly diagnosed with cancer in low income countries in Central America showed that significantly higher mortality rates were related to degree of malnutrition (using percentile BMI for age, MUAC, TSFT and albumin) (14.0% vs 16.8% vs 20.5% for adequately nourished, moderately depleted and severely depleted children respectively [total 18.4%, p = 0.006]). Event-free survival at 2 years from diagnosis was significantly different in the 3 groups (65% vs 57.3% vs 48.4%, p < 0.001).306