
1.4.3 Economic consequences
1.4.3.1 HEALTHCARE RESOURCE USE
- Malnutrition is associated with increased morbidity in both acute and chronic disease,e.g. poor wound healing and postoperative complications such as acute renal failure, pneumonia and respiratory failure. The increased morbidity results in increased health care needs, resulting in increased costs (see Figure 1.28).324
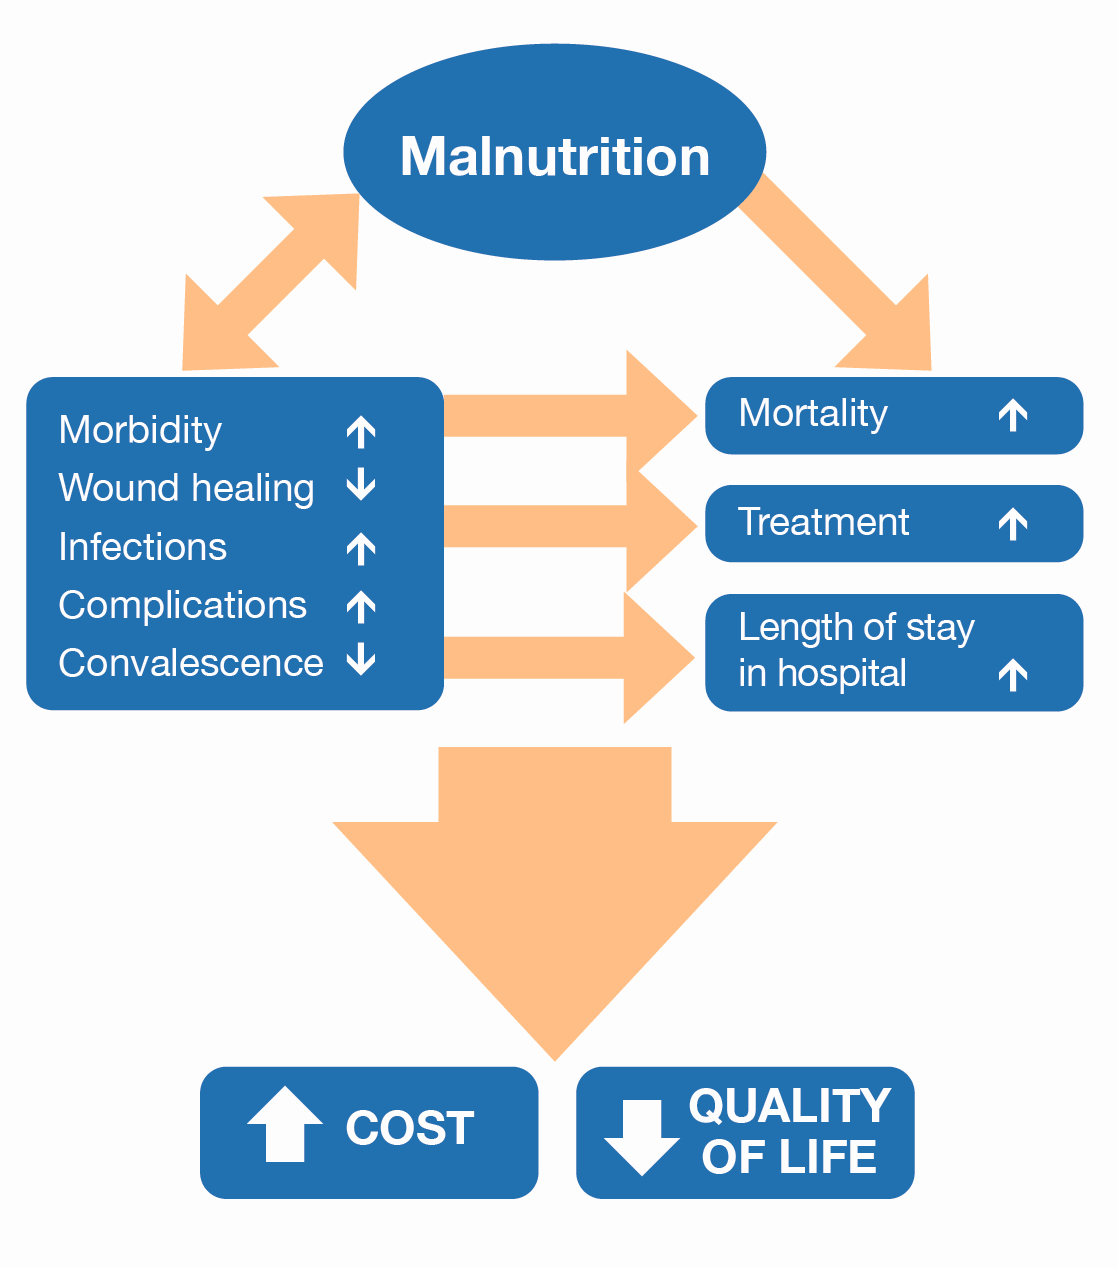
Prognostic impact of malnutrition(adapted from Norman et al. 2008)324
 Malnutrition increases use of healthcare resources by adult and older hospital patients
In prospective and several large retrospective evaluations, studies demonstrate that adults and older patients in hospital (with a variety of conditions) use significantly more healthcare resources than well-nourished patients in terms of (see Table 1.15):
- increases in length of hospital stay;
- increases in readmission rates;
- delays in hospital discharge;
- greater use of healthcare resources.53
A case control study undertaken in adults (mean age 73.7 years) found that patients at risk of malnutrition on admission (according to NRS ≥3) had a significantly longer length of hospital stay. Patients that became at risk of malnutrition during their hospital stay also had a significantly longer length of hospital stay (Figure 1.29).325
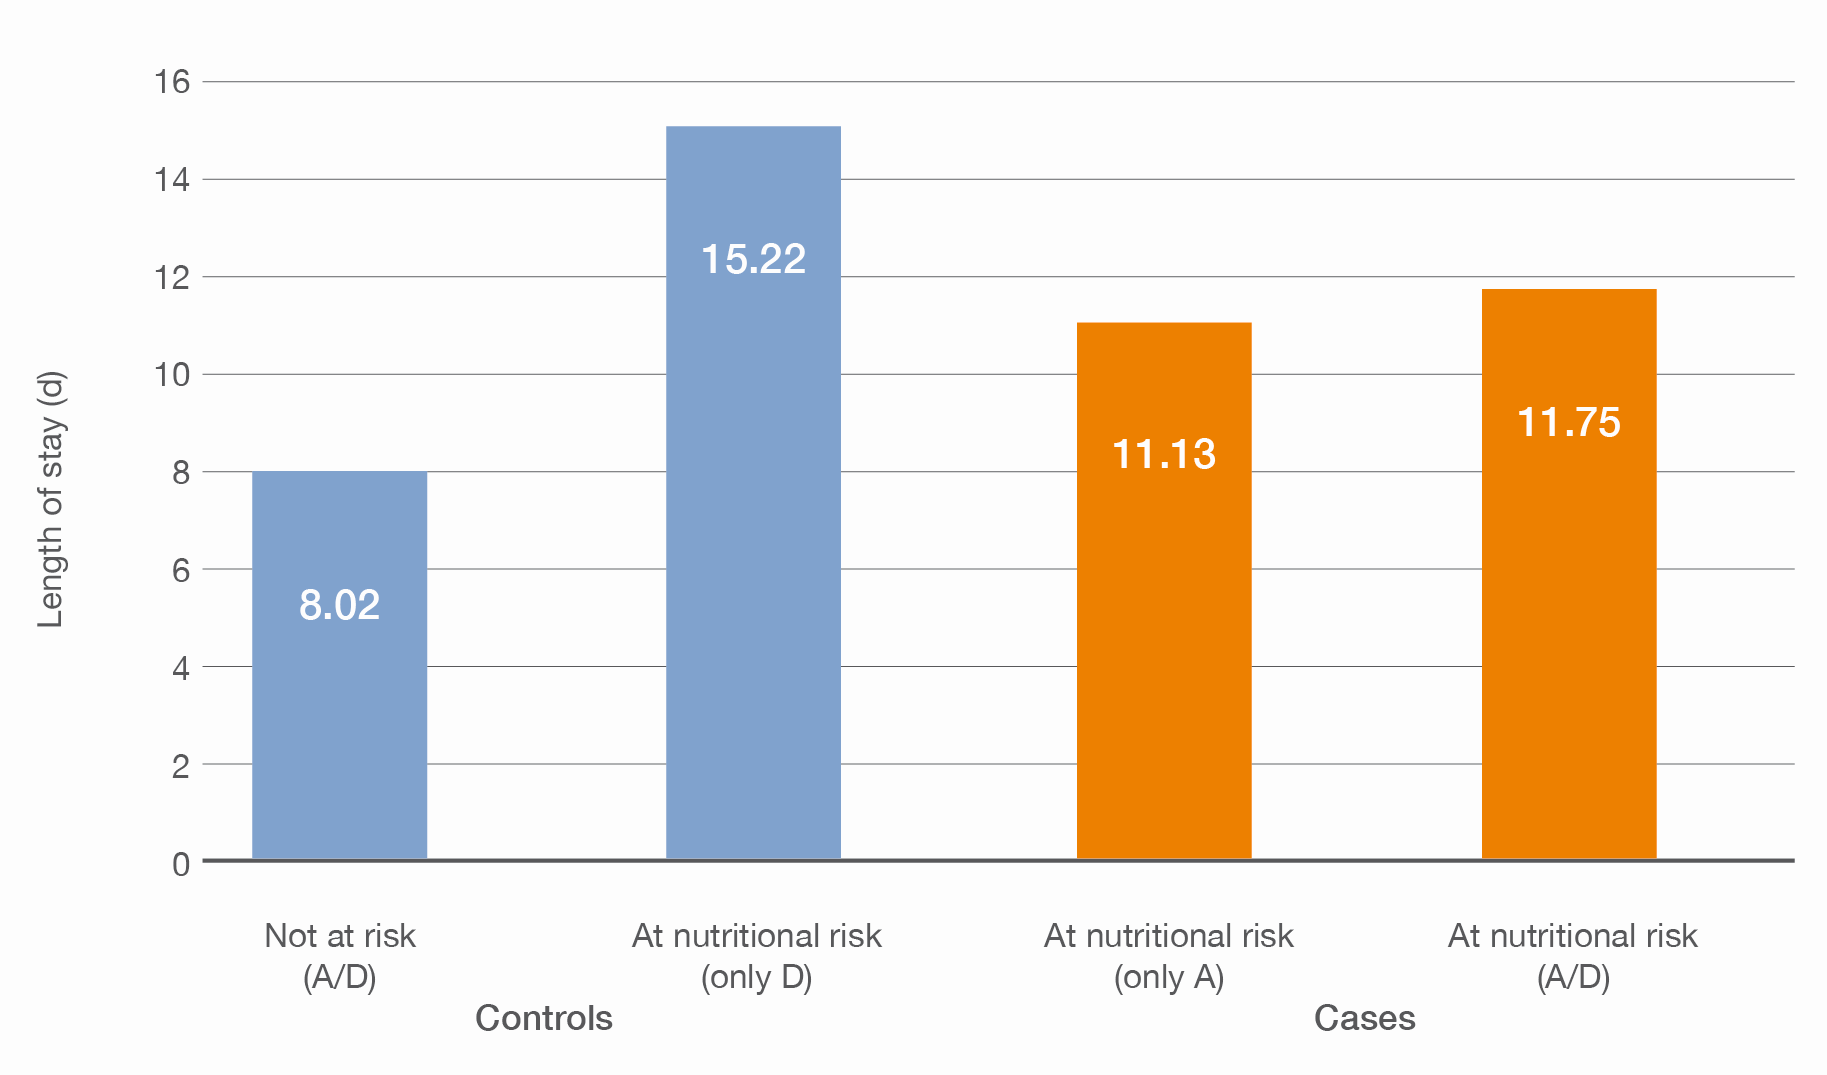
Days of hospital stay according to the presence of nutritional risk at admission and discharge. (adapted from Leon-Sanz et al, 2015) 325
A, admission; D, discharge.
 Malnutrition increases use of healthcare resources by adults and older people in the community
Similarly, in prospective evaluations and 1 large retrospective evaluation, studies demonstrate that adults and older patients (with a variety of conditions) use significantly more healthcare resources than well-nourished patients in terms of (see Table 1.16):
- increases in the number of diagnosed diseases;
- increases in the number of visits to family doctors;
- increases in hospital admissions and readmissions;
- increases in length of hospital stay.
Malnutrition in children is associated with an increased length of hospital stay
- A number of studies have demonstrated that malnourished children have a longer hospital stay compared with well-nourished children (see Table 1.17). This increase in use of healthcare resources is likely to increase the cost of care of malnourished children.
- Abdelhadi et al conducted a large retrospective analysis of over 6 million hospitalised children aged ≤17 years and found that LOS among children with a coded diagnosis of malnutrition (CDM) was significantly longer than those without a CDM (Figure 1.30).
In addition, they found that discharge home with care was 3.5 times more common among malnourished patients (10.9% vs 3.1%, p<0.001).326
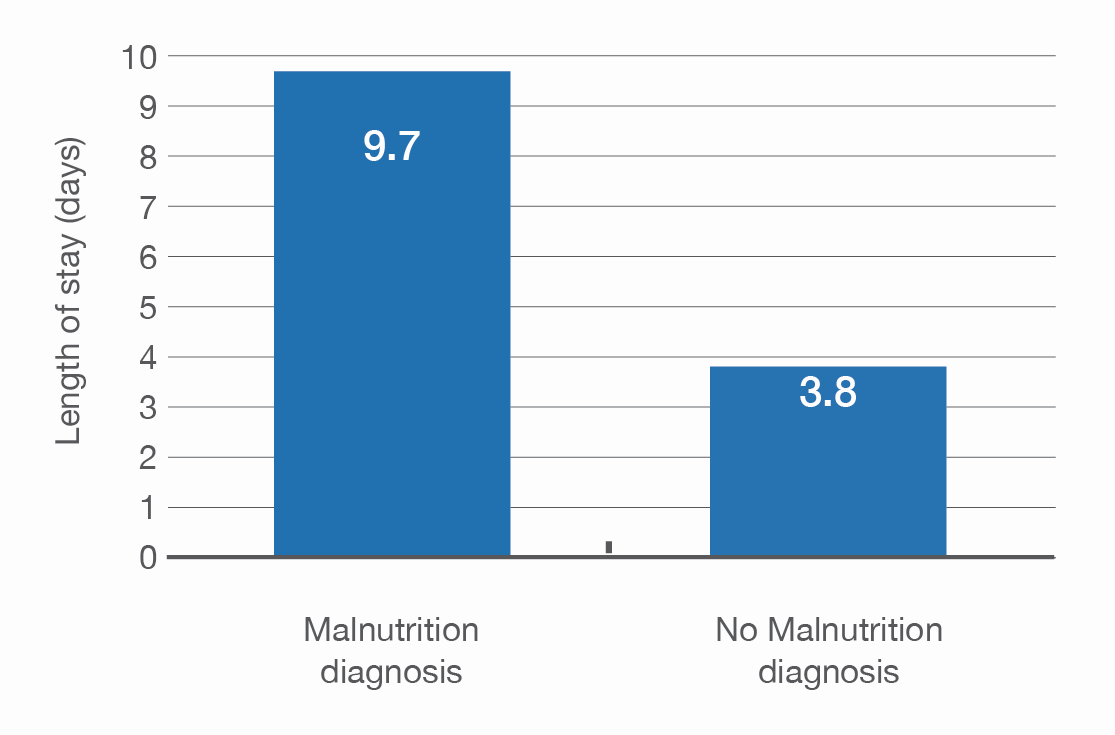
Hospital length of stay of children ≤17 years with a coded diagnosis of malnutrition vs. those without (adapted from Abdelhadi et al, 2016)326
Examples of significantly increased use of healthcare resources by patients identified as malnourished or at risk of malnutrition compared with non-malnourished patients – hospital
| Country/ Region | Study | Population (n) Study design | Method | Malnutrition/risk | Outcome |
|---|---|---|---|---|---|
| Brazil | Leandro-Merhi et al. (2011)327 | Adults and elderly, surgical (n = 350) Prospective evaluation | SGA for adults, MNA for elderly | Adults: 19.3% slightly malnourished, 0.8% at risk Elderly: 11% malnourished, 32.9% at risk |
|
| Canada | Curtis et al. (2016)328 | Adult patients ≥18 years admitted to surgical or medical wards (n = 958) Multi-center Prospective cohort study | SGA | 10.8% severely malnourished 33.5% moderately malnourished 55.7% well nourished |
|
| Europe | Pernicka et al. (2010)329 | Adults (n = 1,346 pairs case/controls) Retrospective evaluation | BMI + weight loss | 7% malnourished |
|
| France | Melchior et al. (2012)330 | Colorectal cancer patients undergoing surgery (n = 453). Post-hoc analysis of prospective study | See details* | 26.7% malnourished 73.3% well-nourished |
|
| France | Nitenberg et al. (2011)331 | Adults, post-surgical colorectal cancer (n = 762) Post-hoc analysis of prospective data | See details* | Not reported |
|
| France | Grigioni et al. (2010)332 | Adults (n = 354) Prospective evaluation | BMI/weight change/ albumin | 29.5% moderate/severe malnutrition |
|
| France | Pressoir et al. (2010)212 | Adults cancer (n = 879) Prospective evaluation | See details** | 10.8% severely malnourished 33.5% moderately malnourished 55.7% well nourished |
|
| Germany | Thomas et al. (2016)333 | Surgical patients (n = 1244) Prospective observational study | NRS 2002 | 24.1% moderate to serious risk (NRS ≥3) 23% slight risk (NRS 1-2) |
|
| Germany | Pirlich et al. (2006)114 | Adults (n = 1,886) Prospective evaluation | SGA | 27.4% malnourished (17.6% moderate and 9.8% severe) |
|
| Singapore | Lim et al. (2012)73 | Adults (n = 818; 530 matched for DRG group) Prospective evaluation | SGA | 29% malnourished (25% moderate and 4% severe) |
|
| Spain | Álvarez Hernández et al. (2015)334 | Adults with dysphagia (n = 352) Observational study | NRS 2002 tool | 45.6% malnourished on admission (NRS≥3) 54.6% ≥70 years malnourished on admission 25.5% <70 years malnourished on admission |
|
| Spain | Gastalver- Martín et al. (2015)335 | Adults Prospective observational study | NRS-2002 and SNAQ | 33% malnourished on admission (NRS ≥3 or SNAQ ≥2) 30% malnourished on discharge (NRS ≥3 or SNAQ ≥2) 19% malnourished on admission and discharge (NRS ≥3 or SNAQ ≥2) |
|
| Spain | Leon-Sanz et al. (2015)325 | Adults Case-control study | NRS 2002 | 24.4% malnourished on admission (NRS ≥3) 22.6% malnourished at discharge (NRS ≥3) |
|
| Spain | Marco et al. (2011)74 | Internal medicine (n = 1,567,659) Retrospective evaluation | Diagnostic codes for malnutrition | 1.4%† |
|
| Spain | de Luis & Lopez Guzman (2006)336 | Adults, internal medicine (n = 213) Prospective evaluation | MNA | 23.9% (MNA < 17) 50.2% at risk (MNA 17–24) |
|
| Spain | Planas et al. (2004)337 | Adults (n = 400) Prospective evaluation | SGA | 46% malnourished |
|
| UK | Gomes et al. (2016)338 | Stroke patients (n = 342) Prospective study | ‘MUST’ | 64% at low risk 7% at medium risk 29% at high risk of Malnutrition |
|
| UK | Slee et al. (2016)339 | Older (frail) adults | ‘MUST’ and MNA-SF Albumin <30g/l (severe) | High risk 14% Medium risk 9% Low risk 77% MNA-SF Normal 9% MNA-SF At risk 45% MNA-SF Malnourished 46% Albumin <30g/l (severe) 42% Albumin 30-34.9 g/l (moderate) 29% Albumin >35 g/l (low/absent) 29% |
|
| US | Weiss et al. (2016)110 | All non-maternal and non-neonatal hospital inpatient stays (n = 27.6 million) Descriptive summary report of Heathcare Cost and Utilisation Project (HCUP) administrative health care data from the National (Nationwide) Inpatient Sample (NIS) | Malnutrition was identified using a broad set of diagnostic codes that included the following six categories: Postsurgical nonabsorption Nutritional neglect Cachexia | 1.95 million hospital stays involved malnutrition i.e. 7.1% of the 27.6 million total |
|
| Poland | Czapla et al. (2022)340 | Hospitalised patients with atrial fibrillation (n = 1,813) Retrospective study | NRS 2002 | 7% at risk of malnutrition (NRS 2002 ≥3) | Patients with NRS ≥3 had significantly longer hospital stays (4.44 vs. 3.53 days, p = 0.005). |
| Netherlands | van Vliet et al. (2020)341 | Hospitalised adult patients (n = 584) Observational study | Patient-Generated Subjective Global Assessment (PG-SGA) at admission, day 5, day 10, and predischarge | 30% of well-nourished patients became malnourished and 82% of malnourished patients remained so | Malnourished patients were more likely to have longer hospital stays |
| USA | Hudson et al. (2018)342 | Hospitalised patients (n = 3,907; (mean age: 61 years malnourished vs. 58 years in non-malnourished) Retrospective study | AND/ASPEN Criteria | 66.88% met criteria for moderate or severe malnutrition | Malnourished patients had longer LOS (15 vs 12 days, P = .0067), were more likely to be readmitted within 30 days (40% vs 23%, P < .0001) and, had a higher in-hospital mortality rate (8% vs 5%, P = 0.0102). and were significantly less likely to be discharged early, p = 0.0001) |
| Italy | Rinninella et al. (2018)343 | Hospitalised adult patients (n = 300) Cross-sectional study | NRS–2002, ESPEN Criteria, Bioelectrical Impedance Analysis (BIA) | 157 (52.3%) patients were at risk of malnutrition; 116 (38.7%) were malnourished | Malnourished patients had longer hospital stays (11.5 ± 8.0 days vs. 9.4 ± 6.2 days, p < 0.05). |
| Germany | Meissner et al. (2020)344 | Hospitalised oncological patients with gastrointestinal tumours (n = 363) Observational study | NRS-2002 | All patients had an NRS ≥ 3 | Malnourished patients had hospital stays extended by 2 to 11.1 days compared to well-nourished patients. |
| USA | Lengfelder et al. (2021)345 | Hospitalised adult patients (n = 416) Prospective observational cohort study | Modified AND/ASPEN 2012 Consensus Criteria | 31.7% were malnourished | Malnourished patients had 2.38 times higher odds of a hospital stay ≥3 days (P < 0.001) and 2.28 times higher odds of readmission within 30 days (P < 0.006). |
| Spain | Martin-Palmero et al. (2017)346 | Hospitalised adult patients (n = 384; 273 medical, 111 surgical) Cross-sectional observational study | ‘MUST’, NRS-2002 Controlling Nutritional Status (CONUT), SGA | 38% were mildly malnourished and 18% severely malnourished | Malnourished patients had a longer hospital stay (9.29 vs. 7.10 days, p = 0.002), used more medications (9.2 vs. 7.4, p = 0.001), and underwent more diagnostic tests (16.4 vs. 12.5, p = 0.002). Malnutrition was associated with higher mortality. |
SGA Subjective Global Assessment; MNA Mini Nutritional Assessment; BMI Body Mass Index; NRS Nutritional Risk Screening; SNAQ Short Nutritional Assessment Questionnaire; ‘MUST’ Malnutrition Universal Screening Tool’; MNA-SF Mini Nutritional Assessment Short Form; LOS Length of stay. *Malnutrition defined as weight loss greater than 10% of usual body weight in the 6 months pre-surgery and/or Body Mass Index (BMI) lower than 18.5 (patients under 70 years) or 21 (patients over 70 years). **See Table 1.10 for definitions of malnutrition used by Pressoir et al, (2010). † Low due to low communication of malnutrition in discharge reports.
Examples of significantly increased use of healthcare resources by patients identified as malnourished or at risk of malnutrition compared with non-malnourished patients – community
| Country/ Region | Study | Population (n) Study design | Method | Malnutrition/risk | Outcome |
|---|---|---|---|---|---|
| Israel | Feldblum et al. (2009)347 | Older people (n = 204) Prospective evaluation | MNA | 38.7% at risk (MNA < 24) | Healthcare use before index hospital admission:
|
| UK | Guest et al. (2011)84 | Adult malnourished (n = 1,000) Retrospective analysis | BMI < 18.5 kg/m2 + clinical indicators |
|
|
| UK | Cawood et al. (2010)348 | Adult outpatients (n = 194) Prospective evaluation | ‘MUST’ | 18% at risk (12% medium, 6% high) |
|
| UK | Collins et al. (2010)301 | Adult COPD outpatients (n = 205) Prospective evaluation | ‘MUST’ | 23.9% at risk (medium + high) |
|
COPD Chronic Obstructive Pulmonary Disease; MNA Mini Nutritional Assessment; BMI Body Mass Index; ‘MUST’ Malnutrition Universal Screening Tool’; LOS Length of stay.
Summary of studies showing increased length of hospital stay in malnourished children or children at risk of malnutrition
| Country/ Region | Study | Population (n) Study design | Method of assessment/screening | Outcome |
|---|---|---|---|---|
| Brazil | Fernandez et al. (2008)147 | Children aged < 3 years (n = 67) Prospective evaluation | Gomez score (WFA) | Linear regression analysis showed an association between longer hospital stay and no weight gain (r2 = 0.11, p = 0.005) |
| Canada | Groleau & Babakissa (2008)138 | Children aged 0–18 years (n = 173) Prospective evaluation | A variety of methods (see Table A1.8, Appendix I) | Length of stay was significantly correlated to nutritional status (r = -0.268, p < 0.05) |
| Canada | Secker & Jeejeebhoy (2007)41 | Children aged 31 days – 17.9 years scheduled for surgery (n = 175) Prospective evaluation | Subjective Global Nutritional Assessment (SGNA) | Postoperative stay was more than twice as long for severely malnourished (19.0±58.8 days) vs well-nourished children (5.3±5.4 days) and moderately malnourished children (8.4±11.1 days) (p = 0.002) (remained significant when extreme outlier removed from the analysis) When taken together, moderately and severely malnourished children had a 55% longer hospital stay than well-nourished children |
| The Netherlands | Hulst et al. (2010)39 | Children aged > 1 month, admission to paediatric ward and expected stay at least 1 day (n = 424) Prospective evaluation | STRONGkids | After adjustment for a variety of clinical factors including younger age, presence of underlying disease, non-surgical reason for admission and non-Caucasian ethnicity, increase in nutritional risk category was significantly related to a longer length of hospital stay (p = 0.017) |
| The Netherlands | Joosten et al. (2010)141 | Children aged > 1 month, admission to medium care unit and expected stay at least 1 day (n = 424) Prospective evaluation | Acute malnutrition = WFH < -2 SD Chronic malnutrition = HFA < -2 SD | Median duration of hospital stay of children with acute malnutrition was significantly longer vs non-malnourished children (median 4 [range 1–44] days vs 2 [1–24] days, p = 0.001) |
| US | Abdelhadi et al. (2016)2326 | Hospitalised Children (≤17 years) (n = 6,280,710) Retrospective analysis using patient-level data on hospital inpatient stays | ICD-9-CM and ICD-10-CM codes that related to malnutrition | LOS among children with a CDM was significantly longer than those without a CDM (9.7days vs. 3.8 days) Discharge with home care was 3.5 times more common among malnourished patients (10.9% vs 3.1%, p < 0.001) |
| Croatia | Niseteo et al. (2020)349 | Children hospitalised on four Paediatric Departments (Gastroenterology, Neurology, Pulmonology and Nephrology) paediatric patients (n = 367), aged ≤ 18 years Prospective longitudinal cohort study | Body weight, height, and BMI (malnutrition classified as BMI -2 to -3 SDS for moderate, BMI < -3 SDS for severe) | Malnourished children had significantly longer hospital stays (12.3 vs. 7.3 days, p = 0.004) and were 5 times more likely to acquire nosocomial infections (RR 5.1, 95% CI 2.276–11.485). |
See Table A1.8, Appendix 1 for details of prevalence of malnutrition and risk of malnutrition. WFA weight for age; WFH weight for height; HFA height for age. ICD-9-CM, International Classification of Diseases, Ninth Revision, Clinical Modification; ICD-10-CM, International Classification of Diseases, Tenth Revision, Clinical Modification